Download
1 / 13
130 likes | 245 Views
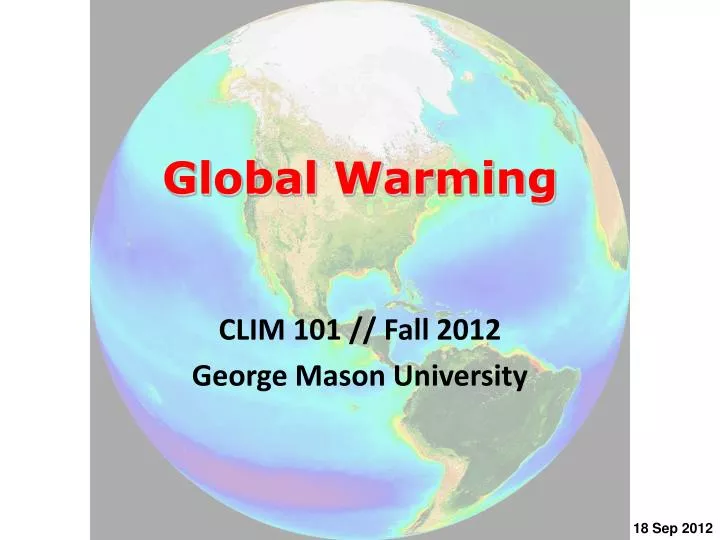
Global Warming. CLIM 101 // Fall 2012 George Mason University. 18 Sep 2012. Global Warming. Global Warming is the increase in the average surface air temperature of the Earth since direct measurements have been taken. . 0.76 °C ( 1.4 °F) since 1900 . 0.55 °C ( 1.0 °F) since 1979 .

E N D
Global Warming CLIM 101 // Fall 2012 George Mason University 18 Sep 2012
Global Warming Global Warming is the increase in the average surface air temperature of the Earth since direct measurements have been taken. 0.76°C (1.4°F) since 1900 0.55°C (1.0°F) since 1979
Global Warming - Terminology “Climate Change: Are We on the Brink of a Pronounced Global Warming” (Broecker, 1975, Science) “Global” signifies average conditions over the whole Earth. However, global warming does not mean equal warming everywhere on the planet; in fact, some regions may be cooling while the global average is warming. Global Climate Change: Suggests changes other than temperature increase. Often used to indicate changes to which human Activities contribute (greenhouse gases, land degradation, deforestation) Global Heating: implies humans are involved; used by Gaia theorist, James Lovelock
LAST TWO MILLENIA OR SO … 2000 Year Northern Hemisphere Reconstruction of Surface Air Temperatures Temperature Anomaly (oC)
Solar Irradiance Recent analyses of satellite measurements do not indicate a long-term trend in solar irradiance (the amount of energy received by the sun), Frohlich and Lean (2005) No significant trend
The Knowns (Observed) • CO2 emissions have grown by 80% between 1970 and 2004. • (2005: 379 ppm; All GHG: 455 ppm (CO2 equivalent); • Primary reason: fossil fuel use and land-use change) • Rate of increase of CO2, CH4, N2O was the largest in 10,000 years. • ------------------------------------------------------------------------------------ • Global mean surface temperature increase (linear trend) 0.76oC in 100 years (1906-2005). • 12 of the past 13 years have been the warmest on record. • In the past 500 years, the warmest 50 year period was 1951-2000.
An Elegant Science Question: Are increases in greenhouse gases responsible for increase in global mean temperature (global warming)? 14.6 Global Temperature & Carbon Dioxide 1860-2008 395 0.76°C (1.4°F) since 1900 14.4 365 0.55°C (1.0°F) since 1979 14.2 335 14.0 13.8 305 13.6 275 13.4
Hypothesis • Greenhouse gases increase due to human activities. • Global warming is due to increases in greenhouse gases. • Global warming is due to human activities. Alternative Hypothesis • Global warming is due to natural variations of climate. How do you test such hypotheses? Climate Models; IPCC
Weather Climate Ecosystems Humans
How Should We Characterize these Relationships (arrows)? • Cause and Effect - changes may occur on either side of the arrow … which is the cause and which is the effect? More specifically, what is the proximate cause and the ultimate cause of any given phenomenon? • Example: Does deforestation change the climate or does climate change alter the trees (or both … see “feedback” below)? • Magnitude - to what degree does one system affect another? • Example: How large a change in climate is required to change the flora or fauna in a given location? • Time Scale - do changes in one system respond on the same time scale as changes in another? • Example: How long must a heat wave persist in order to result in human fatalities? • Feedback - does a change in one system, that results in a change in another, in turn cause the first system to respond? • Positive feedback: the cycle of changes tends to amplify the responses • Negative feedback: the responses in one system tend to reverse the changes in the forcing system • Example: Deforestation may reduce the precipitation in a given region making it unlikely that the forest will grow back
Summary • Global average Earth surface temperature is known to vary annually, interannually, decadally, and on longer time scales • Over the past 150 years or so, especially since 1970, the surface temperature has increased more rapidly than at any time in the current climate epoch • Simultaneously, human activities have substantially increased the concentrations of greenhouse gases • Large trends in other potential (natural) factors determining the mean surface temperature have not been discerned • An elegant scientific question can be posed: are increasing greenhouse gases due to human activity responsible for the observed global warming?