Download
1 / 33
330 likes | 475 Views
Cut-offs for childhood BMI in prediction of cardiovascular disease risk factors in adulthood. Leah Li MRC Centre of Epidemiology for Child Health UCL Institute of Child Health. Imperial College, 16 Nov 2011. Childhood BMI. Trends in child obesity in recent decades

E N D
Cut-offs for childhood BMI in prediction of cardiovascular disease risk factors in adulthood Leah Li MRC Centre of Epidemiology for Child Health UCL Institute of Child Health Imperial College, 16 Nov 2011
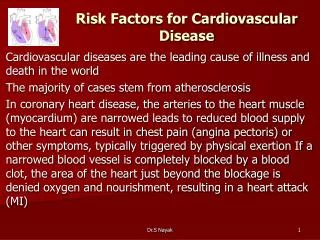
Childhood BMI • Trends in child obesity in recent decades • BMI tracks from childhood to adulthood (obese children more likely to become obese adults) • Adult obesity linked to increased risks of CVD, type 2 diabetes • This raises issue as to whether individuals with high risk of adult disease can be identified from their BMI in childhood • Links between childhood obesity and future health outcomes?
Reference standards for child BMI • Most based on age- gender-specific BMI distribution IOTF cut-offs‡ - correspond to percentile curves for 18y BMI of 25 & 30 kg/m2 Percentile (85th, 90th)† - arbitrary • Defined within reference population, not directly linked to adult health outcomes • Internally derived cut-offs for child BMI (population specific) (require data on BMI in childhood and disease risks in adulthood) † Kuczmarski et al CDC growth charts 2001 ‡ Cole et al 2000
Childhood BMI (kg/m2) at 7, 11, 16y CVD risk factors at 45y: Obesity (BMI ≥ 30 kg/m2) Abdominal obesity (waist ≥ 102/88 cm) High risk of type 2 diabetes (HbA1c 7%; on medication; reported type 2 diabetes; excluding T1 diabetes) Hypertension ( ≥ 140/90 mmHg; on medication) Low HDL-C ( < 1/1.3 mmol/l) High LDL-C ( > 4.13 mmol/l) High triglycerides ( ≥2.3 mmol/l) Study sample1958 British Birth Cohort - born in Great Britain in one week, Mar 1958 (≈17,000), followed up to 50y. Medical assessment at 45y (n=9,377)
Childhood BMI At 7-16y, 6.3-10.5% classified as overweight or obese 7
Childhood BMI At 7-16y, 6.3-10.5% classified as overweight or obese HSE06-08: 21% boys, 24% girls (9-11y) were overweight or obese 8
Childhood BMI At 7-16y, 6.3-10.5% classified as overweight or obese ages. At 45y, 74.9% men, 56.2% women were overweight or obese.
ROC curves of predicting obesity 45 from child BMI(Males & females) ROC analysis (AUC) to assess how well BMI at each age predicts adult obesity
ROC curves of predicting obesity 45 from child BMI(Males & females) AUC increase with age BMI16 was best predictor for adult obesity. Greater increase in AUC (7-11). Than (11-16) ROC analysis (AUC) to assess how well BMI at each age predicts adult obesity
Prediction of adult CVD risk factors from child BMI Prediction improved with increasing childhood age HIGH specificities, but VERY LOW sensitivities for predicting adult outcome, only 4.1-5.2% of non-obese adults were classified as overweight/obese as a child. A substantial proportion of obese adults >75.2% classified as non-overweight as a child. Similar for abdominally obese and high diabetes risk at 45y
Prediction of adult CVD risk factors from child BMI Childhood BMI was a weak predictor for adult hypertension, adverse lipids
Internal cut-offs for child BMI for predicting adult CVD risk factors
Internal cut-offs for child BMI for predicting adult CVD risk factors Internal cut-offs for 1958 cohort , identifying for each CVD risk factor to achieve max combination of sensitivity & specificity Varied according to adult factors, lower than IOTF cut-offs, identified larger proportions of population in childhood as having increased risk of adult CVD risks
Childhood BMI cut-offs for predicting adult CVD risk factors
Prediction of adult CVD risk factors from child BMI Lower specificities than IOTF cut-offs, improved sensitivities Obesity: 29.4% non-obese adults identified as at-risk, 32.7% obese adults not identified using internal cut-offs for BMI16. Diabetes: 23.4-28.4% adults with low diabetes risk identified as above BMI cut-offs in childhood, while 39.8-58.1% adults with high diabetes risks not identified.
Prediction of adult CVD risk factors from child BMI Childhood BMI - weak predictor for adult hypertension and adverse lipids
Prediction of adult CVD risk factors from child BMI Li et al. Am J Clin Nutri (2011)
Summary • Prediction of adverse adult CVD risk factors from childhood BMI was modest: AUC≤0.75 (adult obesity), ≤0.68 (type 2 diabetes risk), ≤0.57 (hypertension or adverse lipid levels) • Born in 1958, LOW child overweight/obesity prevalence by IOTF cut-offs, HIGH in adulthood. Prediction of adult obesity from IOTF cut-offs was low. • Internal cut-offs for this population had higher sensitivities than IOTF cut-offs, but lower specificities. • Low internal (study specific) cut-offs had limited utility for identification of children at high risk of adult CVD outcomes (identified a large proportion of children, differed across adult outcome).
Summary • Prediction of adult CVD risk factors from childhood overweight/obesity was modest in a population experiencing rapid change in obesity prevalence over their lifetime. • Neither IOTF nor our population-specific cut-offs for childhood BMI provided adequate diagnostic tools for adult CVD risk factors in a population experiencing such a rapid change
Life-course BMI trajectories 1946 and 1958 British birth cohorts *Li et al. Am J of Epidemiol (2009)
Association between BMI and adult SBP (males)1946 and 1958 British birth cohorts
Life-course BMI trajectories 1946 and 1958 British birth cohorts *Li et al. Am J of Epidemiol (2009)
Acknowledgements Angela Pinot de Moira Chris power MRC has funded the 45y survey of the 1958 cohort Leah Li is funded as a Career Development Award in Biostatistics
Prediction of adult CVD risk factors from changes of child BMI
ROC curves of predicting obesity45 from BMI changes (7-11, 11-16y, males and females)