Download
1 / 59
590 likes | 781 Views
Melbourne 2009. 11. 18. Galaxy Clustering Topology : Constraints on Galaxy Formation Models and Cosmological Parameters. The CosPA 2009 Meeting, Nov. 18-20, 2009 Changbom Park (Korea Institute for Advanced Study). Why is the topology of LSS useful?. 1. Direct intuitive meanings

E N D
Melbourne 2009. 11. 18 Galaxy Clustering Topology: Constraints on Galaxy Formation Models and Cosmological Parameters The CosPA 2009 Meeting, Nov. 18-20, 2009 Changbom Park (Korea Institute for Advanced Study)
Why is the topology of LSS useful? 1. Direct intuitive meanings 2. At large linear scales Gaussianity of the primordial density field A cosmic ruler 3. At small non-linear scales Galaxy distribution at non-linear scales sensitive to cosmological parameters & galaxy formation mechanism (Gott et al. 1986) (Park & Kim 2009) (Park, Kim & Gott 2005)
Constraining galaxy formation models: 1. The small-scale topology of galaxy distribution depends on cosmological parameters and galaxy formation process. 2. Difference of topology among different types of galaxies reflects their different history of formation. Analysis: 1. SDSS DR7 data - Luminosity, morphology, and color subsets 2. Comparison with the predictions of galaxy formation models
SDSS DR7: KIAS-VAGC Northern Galactic Cap • A SDSS galaxy catalog with 597.1K(10<r<17.6) + 114.3K(17.6<r<17.77) redshifts 7698 sq. deg
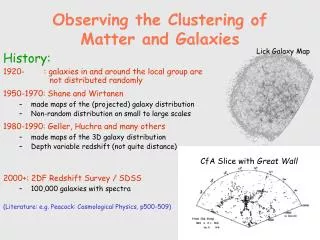
The Cosmic Runner (Park et al. 2005) The Sloan Great Wall (Gott et al. 2005) The CfA Great Wall & the man (de Lapparent et al. 1986)
Voids (blue - 7% low), filaments/clusters (red - 7% high) => Sponge !! SDSS DR4plus (Gott et al. 2008)
Genus G = # of holes - # of isolated regions in iso-density contour surfaces = 1/4π·∫S κ dA (Gauss-Bonnet Theorem) [ex. G(sphere)=-1, G(torus)=0, G(two tori)=+1 ] : 2 holes – 1 body = +1 Gaussian Field Genus/unit volume g(ν) = A (1-ν2) exp(- ν2/2) where ν=(ρ- ρb)/ ρbσ & A=1/(2π)2 <k2/3>3/2 <k2>= ∫ k2P(k)W(k;R)d3k= ∫P(k)W(k;R)d3k
g △ν AV AC G=373 ±18 (4.7%) [Choi et al. 2009]
Scale Dependence of Topology Data: SDSS DR7 BEST (Mr < -20.19) Analysis: LSS fixed. pure scale dependence. Systematic effects corrected using mock surveys in LCDM Results: slow scale dependence of Dn & Av
Non-linear evolution of the topology of matter distribution: LCDM z=0 Ac at z=0 Av at z=0
Bias in LSS Topology Data: SDSS DR7 BEST (Mr < -20.19) WMAP 3yr LCDM matter at z=0 Results: Scale-dependent bias in LSS topology (all g, Dn, Ac & Av)
g g △ν △ν AC AC AV AV Morphology and color dependence of LSS Topology Data: sample volume, # of galaxies & Mr-range in each subset fixed
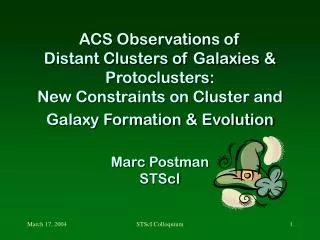
Comparison with the LSS Topology predicted by galaxy formation models 0. Background cosmology = LCDM model with WMAP 3 yr parameters 1. HGC, a Halo-Galaxy Correspondence model [Kim, Park & Choi 2008] Each gravitationally self-bound, tidally stable dark halo (central or subhalo) above certain mass contains one galaxy above certain luminosity 2. HOD, Halo Occupation Distribution [Yang et al. 2007] Bias between galaxy and dark halo P(Ng|Mh) Mean occupation # for central galaxy <Ncen>=1 for Mh>Mmin Satellite mean occupation # <Nsat> = (M/M1)α 3. SAM, Semi-Analytic Models of galaxy formation Merger-tree + physical processes put in Croton et al. (2006) & Bower et al. (2006)'s of SAM (which differ mainly by AGN feedback and cooling); Bertone et al. (2007)'s SAM (galactic wind)
Halo-Galaxy Correspondence model [Kim, Park & Choi 2008] FoF halos gravitationally self-bound, tidally stable halos Mh-Lg relation from N(Mh) & F(Lg) Galaxy sample with a given mean galaxy separation
1-halo ξ 2-halo r Halo Occupation Distribution model of galaxy clustering • Bias between galaxy and dark halo P(Ng|Mh) Mean occupation # for central galaxy <Ncen>=1 for Mh>Mmin Satellite mean occupation # <Nsat> = (M/M1)α • 2 types of pairs: ξ(r) =ξ1h(r) + ξ2h(r) (Sheth 2004)
N-body simulations : SAM Millennium Run 21603 particles in a 512h-1Mpc box. LCDM with WMAP 1yr parameters. Implemented by Croton et al. (06), Bower et al. (06), Bertone et al. (07) which differ mainly by AGN feedback, cooling, and galactic wind feedback treatment
Bertone et al. 2007 Yang et al. 2007 Croton et al. 2006 Bower et al. 2006 Kim et al. 2008 SDSS DR7 Main
Color subsets: red vsblue : 9.1 h-1Mpc scale Bertone et al. 07 Croton et al. 06 Bower et al. 06 : 7.0 h-1Mpc scale Color subsets completely fail to explain the observed topology
Summary [ Observations ] 1. Topology of LSS measured from SDSS DR7 2. Dependence of LSS topology on scale, luminosity, morphology & color is measured. Early-type/red galaxies has smaller genus, is more meat-ball shifted, has more clusters, 3. Topology bias of galaxy distribution with respect to matter is measured. Topology bias is significantly large and scale-dependent. Gravitational perturbation theory is not enough to fit the observations. [ Comparison with galaxy formation models ] 4. Topology at quasi- and non-linear scales can be used to constrain galaxy formation mechanism. All models fail to explain the observed meat-ball shift of large-scale galaxy distribution. SAM and HOD models fail to explain cluster and void abundances. Color subsets of SAM models completely fail to explain the observed topology. Galaxy formation models should be tuned to explain not only the amplitude but also the topology of galaxy clustering!
Large-scale structure as a cosmic ruler Use the sponge topology of LSS or the overall shape of P(k) at large scales as a standard ruler to measure the expansion history of the universe cosmological parameters like Ωmh, w, etc.
(courtesy: A. Kravtsov). LSS are in the (quasi-)linear regime, & maintain the primordial sponge topology at all redshifts! (= the original idea of using topology for the test of the primordial density fieldfor Gaussianity by Gott et al. in 1986) ∴ LSS can be used as a cosmic ruler to measure the expansion history of the universe and to estimate the related cosmological parameters!
Scale dependence of PS encoded in the LSS The genus measures the slope of PS near the smoothing scale (Gaussian case). The PS of each universe model has a specific scale dependence. Use the whole shape of PS, not just the BAO wiggle on top of the smooth PS, as a cosmic ruler. subhalo PS at z=0 matter PS at z=0 & 0.5 Kim et al. (2009) The Horizon Run
Using the LSS topology to measure the expansion history Strategy • choose a reference cosmology with a certain w= P/ρ • convert z of galaxies into r(z) assuming the reference cosmology • calculate the genus • compare the measured genus with the predicted genus in the reference cosmology (the w-dependence originated from the different expansion history of space) Strategy
Suppose the true cosmology is x (expansion history varied by w of DE) looking at a larger smoothing scale + taking a larger unit volume [High z sample] (w= -0.5) [Low z sample] a (w= -1) x b RG genus per unit volume in a wrong cosmology = genus of true cosmology at scaled smoothing length Ⅹvolume factor of true cosmology / volume factor of wrong cosmology (w= -1.5) (Park & YR Kim 2009)
Summary 1. Topology of LSS has been proposed to examine the Gaussianity of galaxy distribution on large scales. This was used to test the primordial density field for Gaussianity, which is one of the major predictions of the simple inflationary scenarios. 2. Topology of galaxy distribution at small non-linear scales is used to constrain the galaxy formation mechanisms and cosmological parameters. 3. We propose to use the topology of LSS as a cosmic ruler to measure the expansion history of the universe and constrain the cosmological parameters governing the expansion. 4. 2D and 1D LSS topology studies too! Redshift slices from the deep imaging surveys - 2d topology Line-of-sight level crossings of Ly-a forest clouds, HI gas distribution - 1d topology
Observational samples Gott et al. (1986): CfA1 Vogeley et al. (1994): CfA2 Gott et al. (2006) : SDSS DR4plus
LSS as a cosmic ruler Filament-dominated Cosmic Web Bond et al. (1996) : Final-state web is present in embryonic form in the overdensity pattern of the initial fluctuations with NL dynamics just sharpening the image.
Cosmic sponge theory Not just overdensity patterns but all large-scale structures including voids maintain their initial topology (sponge) till the present [Initial density field] [Matter density field at z=0] flat LCDM RG=25h-1Mpc
Measured genus density when a wrong cosmology 'a' is adopted = genus of true cosmology at scaled RG Ⅹ(volume factor of true cosmology / volume factor of wrong cosmology) = g(RG')ⅩDV(cosmology x) / DV(cosmology a) where DV = dA2/H(z), RG' = RG Ⅹ[DV(x)/DV (a)]1/3 dA(z) = (1+z)1 r(z) and
LSS Genus & Constraining Dark Energy Suppose we live in a universe with (Ωm, w) = (0.26, -1.0). Let's choose a wrong w when z is converted to r(z). Difference between the predicted and measured genus as z changes. (the w-dependence originates from different expansion history of space) (RG=15h-1Mpc) (Park & YR Kim 2009)
Luminous Red Galaxies: SDSS DR4plus [Gott et al. 2008] deep shallow dark subhalos from LCDM
Observational constraints on the PS shape deep shallow WMAP5; Ωmh2=0.133 SDSS LRG WMAP3; Ωmh2=0.128 SDSS Main Δg = 7.5% (DEEP) Δg = 4% (SHALLOW)
LRGs in SDSS DR4plus : △g = 4% (RG=21h-1Mpc) & 7.5% (RG=34h-1Mpc) Ωm = 0.241 ± 0.014 (if flat LCDM & h=0.72)
Future surveys Constraint on PS shape using only the genus statistic 1. DR7 of SDSS I+II : # of LRGs ~ 100K △g = ~3% & △Ωm = ~ 0.010 2. LRGs in SDSS-III : # of LRGs ~ 1.5M △g = ~0.8% & △Ωm ~ 0.004 [Kim et al. 2008]
Preliminary Constraint on 'w' using the genus statistic only : LRGs in SDSS DR4plus : △g = 4% (RG=21h-1Mpc) & 7.5% (RG=34h-1Mpc) →Δw ~ 0.4 LRGs in SDSS-III: # of LRGs ~ 1.5M △g = ~1.0% in each of 3 z-bins → △w ~ 0.08 [Kim et al. 2008] The Horizon Run (Kim et al. 2009) [Percival et al. 2007]
Needs to deal with non-linear effects from NL gravitational evolution, galaxy biasing, redshift-space distortion [Kim et al. 2009] The Horizon Run (Kim et al. 2008): 41203 particles in 6592h-1Mpc box All sky past light cone SDSS-III mock surveys - subhalos available on the web!
Effects of NL gravitational evolution, biasing, redshift-space distortion, discreteness, & finite pixel size WMAP3 0.271 Matter in real & redshift spaces 0.240 0.203 real redshift Dark subhalos in real & redshift spaces
SDSS Main History of the Universe Inflation Deceleration (Matter Dominated) SDSS III LAMOST Main Deep Reionization Epoch Decoupling Epoch Dark Ages Acceleration (Dark Energy Dominated) Expansionofhuman view of ourUniverse CfA2 Here Now Structure Formation & Evolution The First Objects HI + g + He p + e- + g + He T H E H O R I Z O N R U N Kim, Park, Gott & Dubinski (2009) http://astro.kias.re.kr/Horizon_Run
은하생성모형의 잘 알려진 문제점들 ㄱ. 너무 많은 왜소은하가 만들어짐 ㄴ. z>1에서 붉은 은하를 충분히 만들지 못함 ㄷ. 치솟은 중심밀도 예측 ㄹ. 속도분산 > 300km/s인 은하의 부재 설명 ㅁ. ERO 생성 불가 ㅂ. 두가지 은하종족의 존재 설명
1. 수치실험 N-체 중력수치실험/ 중력 및 유체역학 수치실험 * 우주론적 또는 외떨어진 은하, 짝은하계 등의 초기 조건을 주고, 중력과 유체-열역학 방정식을 풀어 암흑물질, 기체, 별의 진화를 수치적으로 계산함. * 수치실험에 격자기반의 Eulerian (ENZO, FLASH) 코드와 입자기반의 Lagrangian (SPH codes; GADGET, GASOLINE) 코드가 사용됨 * 장점 일부 물리 현상에 대한 정확한 기술 암흑헤일로와 은하의 공간분포와 내부구조에 대한 예측 * 단점 계산의 한계 때문에 넓은 물리적계수 공간을 조사할 수 없고, 고분해 대규모 계산이 불가 일부 물리현상(BH 성장, AGN 피드백) 기술 불가 계산 결과가 관측된 은하 분포와 성질과 잘 맞지 않음 (수치실험+SAM 혼합방법으로 일부 단점 극복)
2. Halo Occupation Distribution (HOD) models * 주어진 암흑헤일로분포로부터 은하분포를 주는 경험적 모형 (암흑헤일로 질량과 은하광도/별질량 관계). 관계설정 계수 * 관측된 광도/질량함수와 광도에 따른 군집상관함수를 맞추도록 모형을 설정 * 특정 은하형태나 색 유형에 대해서 적용 가능 * 장점 은하분포를 정확히 재연할 수 있다(가상탐사자료 생성 수월) * 단점 유일성 결여. 이론적 예측력 결여. 물리적 현상 이해 불가
1-halo ξ 2-halo r Halo-model of galaxy clustering • Bias between galaxy and dark halo P(Ng|Mh) Mean occupation # for central galaxy <Ncen>=1 for Mh>Mmin Satellite mean occupation # <Nsat> = (M/M1)α • 2 types of pairs: ξ(r) =ξ1h(r) + ξ2h(r) (Sheth 2004)
Halo model calculation of ξ(r) Sheth et al. 2001 (R. Sheth 2004) steeper Red galaxies Dark matter Blue galaxies Inflection at transition from 1-halo term to 2-halo term ~constant bias at large r shallower x1h›x2h x1h‹x2h →
HOD Modeling of Luminosity Dependence (Zehavi et al. 2004) Ave. halo mass hosting a satellite M1 ~ 20Mmin Min. host halo mass Fainter > M*~ -20.5 Mmin Llimit Brighter < M*~ -20.5 require higher massbaryon for satellite, IGM/ICM absolute r-Magnitude absolute r-Magnitude
3. Semi-analytic models (SAMs) * 각 암흑헤일로의 질량모음 역사를 N체 실험(또는 해석학적 이론)에서 얻은 암흑헤일로 합체진행로(merger tree)에서 알아내고, 여기에 간단한 물리적 처방을 하여 은하 생성과 진화를 흉내냄. * 포함되는 물리적 현상은 합체, 기체 냉각, 별 생성, 별의 피드백, 활동은하핵의 피드백, 화학적 진화, 별 종족 진화, 성간먼지소광 등이다. * 장점 우주 전 기간에 일어나는 물리적 현상의 결과를 모형 내에서 파악. 여러 물리적 효과를 부여할 수 있음 효율적 계산이 가능하고 융통성 있음. * 단점 물리적 효과에 대한 처방이 근사적임. 비국부적인 현상에 대한 처방과 결과 결여
은하생성에 개입되는 물리적 효과 암흑물질 분포의 계층적 진화 암흑헤일로의 생성과 합체 암흑헤일로 내에서 기체의 가열과 냉각 은하의 합체 별 생성과 별의 피드백(초신성) 활동은하핵의 생성과 피드백 별종족 합성 성간먼지 소광 암흑물질 (Rachel Somerville) 기체 (Shaun Cole)