Download
1 / 16
160 likes | 283 Views
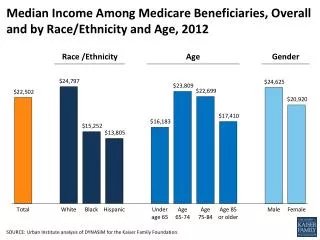
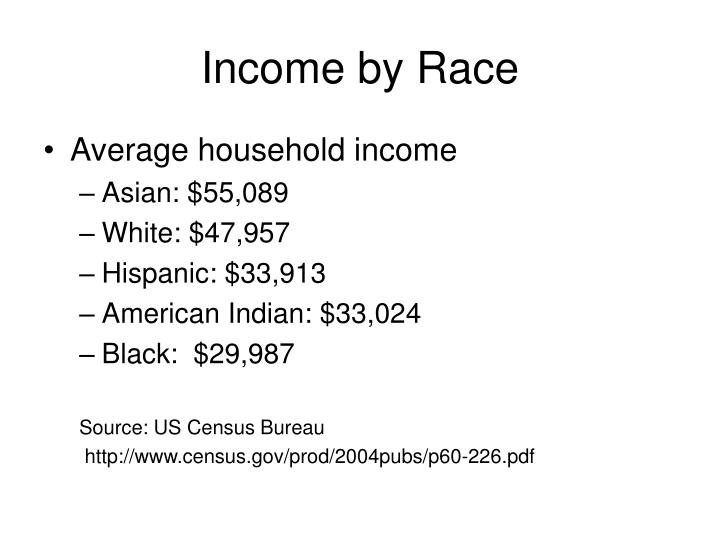
Income by Race. Average household income Asian: $55,089 White: $47,957 Hispanic: $33,913 American Indian: $33,024 Black: $29,987 Source: US Census Bureau http://www.census.gov/prod/2004pubs/p60-226.pdf. Poverty Rate. White – 8% Asian – 10.1% Hispanic – 21.8% Black – 24.1%

E N D
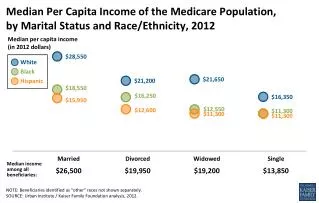
Income by Race • Average household income • Asian: $55,089 • White: $47,957 • Hispanic: $33,913 • American Indian: $33,024 • Black: $29,987 Source: US Census Bureau http://www.census.gov/prod/2004pubs/p60-226.pdf
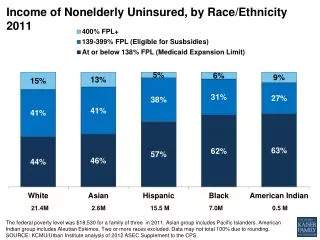
Poverty Rate • White – 8% • Asian – 10.1% • Hispanic – 21.8% • Black – 24.1% Source: US Census Bureau http://www.census.gov/prod/2004pubs/p60-226.pdf
Children born to single mothers • Asians – 15% • Whites – 21% • Hispanics – 41% • American Indians – 58% • Blacks – 69% Source: http://www.catholicculture.org/docs/doc_view.cfm?recnum=1446
Incarceration Rates • White – 1.1% • Hispanic – 2.7% • Black – 7.9% • 603,000 black men in college, 791,000 in prison Source: Human Rights Watch http://www.hrw.org/backgrounder/usa/race/pdf/table3.pdf
High School Graduates • Whites – 91% • Blacks – 83% • Hispanic – 62% Source: National Center for Education Statistics http://nces.ed.gov/pubs98/dropout/ch06t13a.asp
Math Asian: 566 White: 531 American Indian: 479 Hispanic: 445 Black: 426 Verbal White: 529 Asian: 501 American Indian: 481 Hispanic: 456 Black: 433 SAT Scores Source: National Center for Education Statistics “Status and Trends in the Education of Blacks”
College Enrollment • Whites – 45% • Blacks – 40% • Hispanics – 34% Source: American Council on Education http://www.acenet.edu/hena/readArticle.cfm?articleID=1223
% of college students White: 71% Black: 11% Hispanic: 7% Asian: 6% American Indian: 1% % of population White: 75% Black: 12% Hispanic: 12% Asian: 3% American Indian: 1% Enrollment vs. Population Source: National Center for Education Statistics “Status and Trends in the Education of Blacks”
Completion Rates • Students who complete degree within 6 years • Whites: 67% • Blacks: 46% • Hispanics: 47% Source: US Department of Education http://www.philly.com/mld/inquirer/living/education/8931891.htm
Response Groups • In your groups, answer the following questions: • What connections do you see between income, family background, and education? • Why do you think different racial and ethnic groups experience different levels of success? • Should race be a factor in college admissions? • When you are done, write your answers in your interactive notebooks, and be prepared to share your ideas with the class.
Grutter vs. Bollinger • A white student named Barbara Grutter was denied admission to the University of Michigan Law School in 1996. • She filed a suit, claiming she was discriminated against because of her skin color • Cited 14th Amendment “equal protection” • Cited Civil Rights Act (1964) Title VI barring discrimination on the basis of race
UM Law School Admission Policy • Specifically sought “a mix of students with varying backgrounds and experiences” • Used grid based on GPA, LSAT scores to identify strongest candidates • Gave additional consideration to factors such as community service, strength of recommendations, and race
Gratz vs. Bollinger • In 1995, a white student named Jennifer Gratz was denied admission to the university of Michigan • She filed suit, claiming she was discriminated against on the basis of race • Cited 14th Amendment “equal protection” • Cited Civil Rights Act (1964) Title VI barring discrimination on the basis of race
Academics Grades 12 points – SAT score Geography10 points - Michigan Resident6 points - underrepresented Michigan county2 points - underrepresented state Alumni4 points - "legacy" (parents, step-parents)1 point - other (grandparents, siblings, spouses) Essay1 point - outstanding essay (since 1999, 3 points) Leadership and service1 point - state3 points - regional5 points - nationalMiscellaneous20 points - socio-economic disadvantage20 points - underrepresented racial-ethnic minority identification or education5 points - men in nursing20 points - scholarship athlete20 points - provost's discretion Personal achievement1 point - state3 points - regional 5 points - national -- 150 points possible -- 100 points usually assures admission Michigan Admissions Policy
2003 Supreme Court Rulings • Grutter vs. Bollinger • Supreme Court ruled that considering race was acceptable, as long as it was “narrowly tailored” to achieve diversity • Justice O’Connor: "We expect that 25 years from now, the use of racial preferences will no longer be necessary to further the interest approved today. Source: NPR http://www.npr.org/news/specials/michigan/
2003 Supreme Court Rulings • Gratz vs. Bollinger • Supreme Court ruled that use of point system was not “narrowly tailored” and thus violated 14th amendment “equal protection” clause • Quotas not legal Source: NPR http://www.npr.org/news/specials/michigan/