Download
1 / 46
460 likes | 663 Views
The Economics of and Business Case for Infection Prevention February 19,2009. Janet Frain, RN, CIC, CPHQ, CPHRM Director, Integrated Quality Services Sutter Medical Center, Sacramento APIC Past-President, 2008. Cost. Benefit. VS.

E N D
The Economics of and Business Case forInfection Prevention February 19,2009 Janet Frain, RN, CIC, CPHQ, CPHRM Director, Integrated Quality Services Sutter Medical Center, Sacramento APIC Past-President, 2008
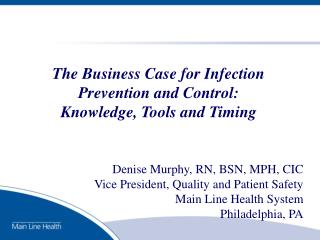
Cost Benefit VS. Know the Business Case for Infection Prevention and Control • The impact of healthcare associated infections (HAI) and occupational exposures (OH) makes the best case: • Clinical impact: morbidity & mortality • Cost of infections & exposures • The cost benefit of IPC • Cost-effectiveness of IPC interventions • How to quantify the return on investment (ROI)… then negotiate for resources! • IN GOD WE TRUST… • ALL OTHERS MUST PROVIDE DATA!
Making the Business Case for Preventing HAI • HAI are responsible for more deaths in the US than the top ten leading causes of death (PH Report - CDC) • SENIC study estimated 32% of HAI are preventable if effective ICHE program in place* • Possibly 50% preventable today! • Preventing 35% - 50% HAI would save a minimum of $260K - $440K • Savings = budget for IPC program with ~ 6 FTEs We all know this…do our healthcare executives know this? Source: *Haley, et al. Am J Epidemiol 1985;121:159-67, 182-205 Note: costs in 1985 dollars
40 36K 35 Number Deaths in Thousands 31K N = 98,987 30 Pneumonia 25 BSI 20 UTI 13K 15 11K SSI 8K Other HAI 10 5 0 Death from HAI in the U.S. 2002 Most important bottom line… Source: Public Health Report/March-April 2007/Volume 122
Attributable Costs and Excess Length of Stay Associated with HAI SOURCE: Eli N. Perencevich, MD, MS; Patricia W. Stone, PhD, MPH, RN; Sharon B. Wright, MD, MPH et al. Infect Control Hosp Epidemiol 2007;28:1121-1133
Comparison of Economics – Patients with and without Catheter-related Bloodstream Infection Shannon et al. Amer J Med Quality Nov/Dec 2006; pgs 7S-16S
MRSA Infection= Increased Cost/LOS Source: Cosgrove SE et al. Infect Control Hosp Epidemiol 2005;26:166-74; Reed SD et al. Infect Control Hosp Epidemiol 2005;26:175-83; Engemann JJ et al. Clin Infect Dis 2003;36:592-8
Volumes and patient flow = $$$ • Patients without HAI are discharged sooner • New patients move into those beds • Assuming fixed costs stay the same (building, utilities, etc.), available “bed-days” increase volumes and revenue, reimbursement. • Example: Table 1. shows CABG SSI mean excess LOS = 26 days. *Preventing 10 CABG SSI would open up 260 “bed-days”. If average LOS without complication is 4 days, then 65 new patients could be admitted. *Modified from: Perencevich, Stone, Wright
Impact of Occupational Exposures (OE) • The CDC estimates 385,000 needlesticks and other sharps-related injuries are sustained by hospital-based healthcare personnel annually • Average of 1,000 sharps injuries per day • Since 12/01, 57 confirmed & 138 possible cases of HIV in HCWs from occupational injury** • 84% of documented transmission was due to needlestick injuries. *http://www.premierinc.com/all/safety/resources/needlestick/ **http://www.cdc.gov/sharpssafety/
Impact of OE(cont.) • Several hundred HCWs still acquire hepatitis B virus annually,despite available vaccine • 95% decrease in HBV since 1983 as a result of OSHA mandating HBV vaccine** • The average risk of hepatitis C virus transmission following needlestick exposure to an HCV infected patient is 1.8% • There is no vaccine for prevention of HCV • Cirrhosis & death frequently result from these infections **Mahoney, Arch Intern Med 1997; 157 (22):2601-05
Financial Impact of OE *MMWR,May15, 1998;47 (RR-7) • National costs: average $300-3,000/needlestick injury (depending on risk); if infection results, costs can reach $1 million/case** • Costs include patient & employee f/u: • post-exposure testing (HIV, HBV, HCV, toxicity screen) • prophylaxis (largely cost of new anti-retrovirals) • occupational health nurse (&/or physician) time • employee lost work time, cost of illness, productive years lost • worker’s compensation costs • potential for litigation (Yale MD awarded $12.2 million***) ** G. Pugliese, Proceedings of Committee On Safer Needle Devices, New York, 1998 *** Pugliese, Salahuddin, Eds.,“Sharps Injury Prevention Program: Step-by-step Guide”, AHA, 1999
Components of Total Cost • Direct cost savings (direct payment for healthcare goods and services): • No routine ventilator circuit changes • $1M savings across a system or facility (equipment/supplies) • Indirect cost savings (work productivity) • Increase in Respiratory Therapist productivity due to fewer vent circuit changes (focus on reducing VAP) • Increase in flu vaccine (lower RN absenteeism/ agency costs)
Components of Total cost • Lost opportunity costs (what you give up when you use a resource) • Fewer CABG SSI resulted in fewer I&D cases in OR; • Opportunity for more 1st time CABG surgery cases brought higher reimbursement • Intangible costs (cannot easily assign a monetary value) • Lessen risk for negative PR (impact on referrals) • Impact on societal trust • Changes in insurance premiums due to high cost of HAIs • Impact on status with accreditation and regulatory agencies
Components of Total Cost • Cost (or revenue loss) avoidance • Outbreak of SSI: difference in observed vs. expected SSI rates/excess cost & LOS • Reduce adverse outcomes on CMS list of “conditions not present on admission” that will no longer receive reimbursement • CR-BSI • Mediastinitis, Total Joint Replacement, and Bariatric SSI • UTI
Personal/Individual Costs • Physical pain and discomfort • Mental and financial stress • Increased length of stay in hospital • Prolonged or permanent disability • Disruption to patient and family • Time lost from work for patient and caregivers • Death
Societal Impact of HAI • Beyond excess healthcare costs... • - Indirect costs to family and caretakers • - Years of productive life lost • - Emotional/social burden • - Decreased trust in the healthcare system • - Increased use of antibiotics
Considerations • Getting local information is powerful but complicated • If you cannot use organizational costs, use cost estimates from the literature • Pick something, be able to explain it. Then stick to it!
Converting Old $ to New $ • Healthcare inflation rate is ~ 4 % or more annually, so 1985$ ~ adjusting up to 2007$ means multiplying EACH YEAR between 1985-2007 by the inflation rate. This is a very crude adjustment. • Adjusted for inflation, a bloodstream infection that cost 18,432 in 2005 will cost 4.5% more/year or $19,261 in 2006 and 20,128. in 2007. Source: Consumer Price Index, Bureau of Labor Statistics for the US Medical Care Inflation http://146.142.4.24/cgi-bin/surveymost?cu Source: D. Murphy, 2006
Where Can You Start? • Select type of infection to estimate; SSI easiest • Use accounting dept to obtain individual costs and LOS for patients undergoing specific surgical procedure • List patients who developed SSI. • Use accounting to calculate additional costs: readmission, return to OR, ICU stay, antibiotics, etc. • Compare cost of patients without SSI to patients with SSI who had procedure during same time period • Consider age, gender, diabetes, smoking weight • Compare length of hospital stay, including readmission for SSI, for those with infection
Attributable Costs • Attributable cost is one that would not have occurred during a hospitalization that is identical to the one being analyzed except for the absence of the complication (or infection) of interest. • Easiest to do with surgical patients – re-operation or readmission • Example: Patient with CABG SSI is compared to “matched” patient who underwent CABG…all is identical except for the CABG SSI. • Even these are estimates – why? Hard to prove patient conditions are “identical” at any given time!
$150,000 50 hospital charges hospital days $125,000 40 $100,000 30 $75,000 20 $50,000 10 $25,000 $0 0 none deep leg deep chest EXCESS COST OF CABG SSI Local Impact of HAI gets attention: Source: Hollenbeak, Murphy, Dunagan et al. CHEST 2000; 118:397-402. Barnes-Jewish Hospital, BJC HealthCare
Comparison of Endemic vs. Epidemic SSI Rates Unit: Hospital A Period of increased SSI 6/98 - 12/98 Surgical procedure Gastric Bypass Number of procedures performed in 1998 70 Reported “benchmark” SSI rate/100 procedures 2.7-5.1 Operating unit endemic rate/100 procedures 2.86% (2 SSI / 70 procedures) Operating unit epidemic rate/100 procedures 22.6% (7 SSI / 31 procedures) Average LOS for uninfected vs. infected 4 days vs. 22 days Mean excess LOS per SSI 18 days Average cost for uninfected vs. infected $7,816 vs. $44,963 Mean excess cost per SSI $37,147 Rate reduced to baseline/ benchmark (date) 3.0% (4/99 through 4/2000) Projected # procedures 2000 70 cases Expected # SSI based on endemic (3.0) rate 2 SSI Expected # SSI based on epidemic (22.6%) rate 16 SSI # SSI avoided (based on *reduced rate) 14 SSI annually *Estimated cost avoidance 1999 - 2000 $520,058 ($37,147 x 14) *Estimated cost avoidance is based on the #SSI avoided annually when rates remain at baseline (endemic) compared to epidemic rates. SAMPLE REPORT
Understand CAVEATS:Does Reducing HAIs Benefit the Organization? • IPs must be careful claiming there are always actual savings related to prevention • Executives can’t always find the savings on the organization’s bottom line: • Fixed costs don’t change with reduction in HAIs • Many variable costs are “sticky” – don’t decrease with reduction in HAI either – still need staff WHY?
Reimbursement May Dictate Whether $$ are Saved or Lost • Fee for service insurers may pay for longer hospitalization & readmission; therefore, the organization is making money on the HAI • Managed care organization contracts result in losses to the organization if the cost of caring for a patient is increased by an infectious complication • Organization is paid a fixed fee per member per month; prevention saves money in this environment Souce: Rhinehart, AJIC, 2000; 28:25-9
Know Who Pays for HAI • In the short-run, determined by the payer and the contract • CMS Pay for Performance will profoundly impact this • Over the long haul, it’s always the same • Patients – out of pocket expenses & lost wages • Employees – increased health premiums / lower salaries • Consumers – higher product & service prices
Demonstrating The Value and Cost-Effectiveness of Infection Prevention and ControlFocus on Interventions!
What Percent of HAIs are Preventable? • 10-70% HAIs preventable with appropriate infection control depending on setting, study design, baseline infection rates and type of infection • Concluded at least 20% of all healthcare-associated infections probably preventable Source: Harbarth S, et al. J Hosp Infect 2003;54:258-266
Interventions may include… • Appropriate equipment • Real time analysis of HAIs • Rapid response teams • Data feedback and transparency • Web-based education • Human factors training • Evidence-based practices (bundles) • Source: APIC Presidential Address, D. Murphy, June 2007
Cost-Effectiveness and Cost Benefit Analysis • Comparison of 2 or more interventions • Costs are measured in monetary units • Outcomes are measured in natural units • (e.g., patients surviving, years of life saved, infection prevented/avoided) • EXAMPLE: Comparing cost of silver-coated catheters vs. standard urinary catheters and the effectiveness in reducing UTI. C.S. Hollenbeak, 2006
BSI IC Cost Benefit Analysis Example: Intervention Modules to Prevent BSI Development costs: 6 ICPs @ $23/2 hrs./12 mos.=$3,312 Graphics & printing =$1,300 $4,612 Implementation costs: 20 ICPs @ $23/16hrs. = $12,000 600 RNs @ $23/1hr. = $13,800 100 PCTs @ $12/1hr. = $ 1,200 52 MDs @ $100/1hr. = $ 5,200 $32,200 Development & Implementation costs = $36,812
IC BSI Cost Benefit Analysis BSIs prevented in 2000 Expected BSI =90 (based on previous two years rates) Observed BSI = 45 BSI prevented post intervention = 45 Estimated cost savings = $4,500 x 45 = $202,500 Cost Savings - Intervention Costs = Net Savings $202,500 - $36,812 = $165,688
BJC HealthCare - Impact of Interventions to Decrease Healthcare Associated Infections CABG Surgical Site Infections (SSI) 2000 2001 Impact of Interventions #SSI 116 86 -30 %SSI 5.21% 4.26% -26% Excess Cost $2,440,000 $1,737,945 -$801,340 Spinal Surgical Site Infections (SSI) #SSI 64 58 -6 %SSI 1.7% 1.5% -10% Excess Cost $716,345 $659,394 -$90,000 Ventilator Associated Pneumonia (VAP) 294 160 -134 #VAP -46% VAP/1,000 ventilator days 7.5/1,000 3.9/1,000 Excess Cost $1,385,600 $2,449,020 -$1,160,440 $1,822,426 Total Cost of All HAIs tracked $5,605,365 $3,782,939
vs. Making the Business Case forInfection Control • Ultimately a question of the balance between... Costs of Infection Control Benefits of Infection Control
Component Annual Cost(s) Personnel 0.5 Physician 70,000 1 Nurse 30,000 1 Secretary 15,000 0.5 Computer Programmer 15,000 Supplies, fax. Etc. 20,000 Fringe benefits and overhead 50,000 $200,000* Total Know the Cost of an EffectiveInfection Prevention and Control Program *Add computer & adjust for inflation, this cost would be >$260,000 in 2008 Wentzel. J Hosp Inf 1995; 31: 79-87; *1992$
Staffing Requirements for NNIS Hospitalsbased on minimum requirement of 100 occupied beds • 2001 Delphi Study • *0.8 to 1.0 ICP per 100 occupied beds acute and long-term care • Physician time not measured *O’Boyle C, Jackson MM, Henly SJ. Staffing requirements for infection control programs in US Health care facilities: Delphi project. AJIC 2002;30;6:321-33.
Secure Resources to SupportEffective Programs • IC resources should be allocated based on: • Demographics of population • Most common diagnosis • High risk populations • Services offered • Type and volume of procedures performed • What is NOT BEING DONE due to inadequate resources THAT SHOULD BE DONE to improve patient care *O’Boyle C, Jackson MM, Henly SJ. Staffing requirements for infection control programs in US Health care facilities: Delphi project. AJIC 2002;30;6:321-33.
Show the VALUE of IPC: Functional value includes: • Eliminating waste/improving productivity through • Wise product selection • Appropriate application of expensive technology • Sensible policies & procedures • Protection of employees from injury • Maintaining regulatory compliance • Creating effective collaboration between clinicians and administration • Creating a safer environment for patients and staff, increasing satisfaction • Helping to maintain organizational reputation for service excellence
Show the VALUE of IPC:Strategic value includes: • Supporting organization’s strategic plan • To grow volumes: • Empty out ICU beds more quickly by reducing • To grow services: Gastric bypass surgery new for your organization? Use literature and experience of others to build in risk reduction strategies. • To hit target on 100% of quality scorecards! • Same skills used for outbreak investigation can help PI teams get to root causes of poor performance.
Resources (continued) • How can you get more IPC resources at your facility? • Constant assessment and relentless annual negotiations. • Looking outside of hospital • Collaboration with universities for MPH students • Grant-funded positions • Clinical projects for graduate students • Proving our value year after year; increasing visibility of program; focusing on interventions = REDUCING HAIs!
So what’s my real return on investment? NOTE: Once our value was established, we didn’t have to keep proving it to executives (in dollars saved!) We changed the way they think about ICHE! We just have to keep reducing infections!
Go ing For Zero 56ICU Primary Bloodstream Infection Rates 2006 Through Present 8 6 BSI Rate (per 1000 line days) 4 2 0 Jan Feb Mar Apr May Jun Jul Aug Sep Oct Nov Dec Jan Feb Mar Apr May Jun Jul Aug Sep Oct Nov Dec Jan Feb 2006 2007 2008 Rate Mean NHSN Source: Barnes Jewish Hospital Epidemiology and Infection Prevention Department
In Summary • Do know and share the impact of HAI and all benefits of IP • Don’t do your own cost-benefit studies; use estimates from the literature… adjust for inflation • Do understand the caveats (economics of IP) and what is most important to your healthcare and governmental leaders! • Don’t base your case on solely on reducing costs of HAIs avoided • Do focus on interventions to reduce HAI…and demonstrate, market your value • Don’t forget: Infection Prevention is the right thing to do!
References and Helpful Resources • HAI Statistics and IPC PROGRAMS: • Klevens, Edwards, Richards et al. Pub Health Report. 2007;122:160-6 • Eli N. Perencevich, MD, MS; Patricia W. Stone, PhD, MPH, RN; Sharon B. Wright, MD, MPH et al. • Infect Control Hosp Epidemiol 2007;28:1121-1133 • Horan-Murphy E, Barnard B, Chenowith C, Friedman C, Hazuka B, et al. APIC/CHICA-CanadInfection Control and Epidemiology: Professional and Practice Standards. Am J Infect Control. 1999 Feb; 27 (1):47-51 • Scheckler WE, Brimhall D, Buck AS, Farr BM, Friedman C, Garibaldi R, et al. Requirements for Infrastructure and Essential Activities of Infection Control and Epidemiology in Hospitals. Am J Infect Contol. 1998 Feb;26 (1):47-60. • Friedman C, Barnette M, Buck AS, Ham R, Jarris JA, Hoffman P et al. Requirements for Infrastructure and Essential Activities of Infection Control and Epidemiol in Out-of-Hospital Settings. Infect Control Hosp Epidemiol. 1999. Oct; 20 (10):695-705. • FOCUS ON INTERVENTIONS: • Murphy DM. From Expert Data Collectors to Interventionists: Changing the Focus for Infection Control Professionals. Am J Infect Control. 2002 Apr; 30 (2):120-32. • Garcia R, Barnard B, Kennedy V. The Fifth Evolutionary Era in Infection Control: Interventional Epidemiology. Am J Infect Control. 2000 Feb; 28 (1):30-43. • Eli N. Perencevich, MD, MS; Patricia W. Stone, PhD, MPH, RN; Sharon B. Wright, MD, MPH et al. • Infect Control Hosp Epidemiol 2007;28:1121-1133. • Shannon et al. Amer J Med Quality Nov/Dec 2006; pgs 7S-16S • BUSINESS CASE FOR IPC PROGRAMS • Dunagan WC, Murphy DM, Hollenbeak CS, Miller SB. Making the Business Case for Infection Control: Pitfalls and Caveats. Am J Infect Control. 2002 Apr;30 (2):86-92. • Fraser VJ, Olsen MA. The Business of Healthcare Epidemiology: Creating a Vision for Service Excellence. Am J Infect Control. 2002 Apr; 30 (2):77-85. • Fraser VJ. Starting To Learn About The Costs of Nosocomial Infections in the Millenium: Where Do We Go From Here? Infect Control Hosp Epidemiol. 2002 Apr;23 (4):174-6.
References for Perenchovich Cost/LOS Table • 19. Dietrich ES, Demmler M, Schulgen G, et al. Nosocomial pneumonia: a cost-of-illness analysis. Infection 2002; 30:61-67. • 20. Hugonnet S, Eggimann P, Borst F, Maricot P, Chevrolet JC, Pittet D. Impact of ventilator-associated pneumonia on resource utilization and patient outcome. Infect Control Hosp Epidemiol 2004; 25:1090-1096. • 21. Warren DK, Shukla SJ, Olsen MA, et al. Outcome and attributable cost of ventilator-associated pneumonia among intensive care unit patients in a suburban medical center. Crit Care Med 2003; 31:1312-1317. • 22. Rello J, Ollendorf DA, Oster G, et al. Epidemiology and outcomes of ventilator-associated pneumonia in a large US database. Chest 2002; 122:2115-2121. • 23. Safdar N, Dezfulian C, Collard HR, Saint S. Clinical and economic consequences of ventilator-associated pneumonia: a systematic review. Crit Care Med 2005; 33:2184-2193. • 24. Blot SI, Depuydt P, Annemans L, et al. Clinical and economic outcomes in critically ill patients with nosocomial catheter-related bloodstream infections. Clin Infect Dis 2005; 41:1591-1598. • 25. Digiovine B, Chenoweth C, Watts C, Higgins M. The attributable mortality and costs of primary nosocomial bloodstream infections in the intensive care unit. Am J Respir Crit Care Med 1999; 160:976-981. • 26. Rello J, Ochagavia A, Sabanes E, et al. Evaluation of outcome of intravenous catheter–related infections in critically ill patients. Am J Respir Crit Care Med 2000; 162:1027-1030. • 27. Coello R, Charlett A, Wilson J, Ward V, Pearson A, Borriello P. Adverse impact of surgical site infections in English hospitals. J Hosp Infect 2005; 60:93-103. • 28. Coskun D, Aytac J, Aydinli A, Bayer A. Mortality rate, length of stay and extra cost of sternal surgical site infections following coronary artery bypass grafting in a private medical centre in Turkey. J Hosp Infect 2005; 60:176-179. • 29. Hollenbeak CS, Murphy DM, Koenig S, Woodward RS, Dunagan WC, Fraser VJ. The clinical and economic impact of deep chest surgical site infections following coronary artery bypass graft surgery. Chest 2000; 118:397-402. • 30. Jenney AW, Harrington GA, Russo PL, Spelman DW. Cost of surgical site infections following coronary artery bypass surgery. ANZ J Surg 2001; 71:662-664. • 31. Tambyah PA, Knasinski V, Maki DG. The direct costs of nosocomial catheter-associated urinary tract infection in the era of managed care. Infect Control Hosp Epidemiol 2002; 23:2714.