Download
1 / 14
140 likes | 264 Views
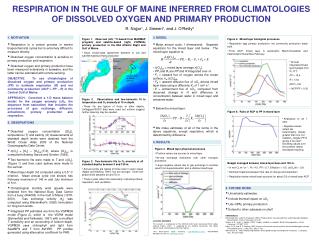
Methane measurements at Bremen, Ny Alesund, Paramaribo and on board Polarstern. K. Petersen 1 , T. Warneke 1 , J. Notholt 1 and O. Schrems 2. 1 Institute of Environmental Physics, University of Bremen, Germany 2 Alfred Wegener Institute, Bremerhaven, Germany. Measurement sites.

E N D
Methane measurements at Bremen, Ny Alesund, Paramaribo and on board Polarstern K. Petersen1, T. Warneke1, J. Notholt1 and O. Schrems2 1 Institute of Environmental Physics, University of Bremen, Germany 2 Alfred Wegener Institute, Bremerhaven, Germany
Measurement sites Ny Alesund since 1992 Bremen since 2000 Paramaribo Sep 04 - Feb 06 Merida Upcoming? Ship-cruises (since 1994)
Bremen FTS-MIR 2000 - ongoing FTS-NIR 2003 - ongoing
Ny Alesund (Spitsbergen, 79°N) Ny Alesund (Spitsbergen) FTS-MIR 1992 - ongoing FTS-NIR 2002 - ongoing In-situ (surf.) 1994 - ongoing
Seasonal variation of CH4 at Ny Alesund year Warneke et al, GRL 2006
Precision of column averaged vmr Warneke et al, GRL 2006
Polarstern Photo: C. Weinzierl FTS: Oct/Nov 1994, Oct/Nov 1996, Dec 99/Jan 00, Jun/Jul 00, Oct/Nov 2002, Jan/Feb 2003, Oct/Nov 2003, Oct/Nov 2005 Surface flasks: Oct/Nov 2005
Comparison model and FTS Model by P. Bergamaschi, European Commission Joint Research Centre, Ispra, Italy latitude Warneke et al, GRL 2006
Paramaribo (5°N) Aug-Dec ITCZ north of PMB Feb-Mar ITCZ south of PMB
Comparison model and in situ data with FTS Model by J. F. Meirink, Institute for Marine and Atmospheric Research Utrecht, Utrecht, The Netherlands
Averaging kernels and apriori profile FTS and SCIAMACHY FTS SCIAMACHY
Comparison FTS and SCIAMACHY with model data Model by J. F. Meirink, Institute for Marine and Atmospheric Research Utrecht, Utrecht, The Netherlands SCIAMACHY data (IMAP-DOAS v1.1) by C. Frankenberg Institute for Marine and Atmospheric Research Utrecht, Utrecht, The Netherlands
Backward trajectories Campaign Aut05 Campaign Aut04 Campaign Spr05 Campaign Spr06 850 hPa Southern Hemisphere - Autumn campaigns Northern Hemisphere - Spring campaigns Backward Trajectories by BADC (British Atmospheric Data Centre) Trajectory Service
Summary • Precision of the column averaged vmr of CH4 is better than 0.5%. • At Ny Alesund (79°N): • - seasonality of tropospheric CH4 (FTIR) and surface CH4 compare well • Latitudinal variation: • - Good agreement with model –> tropical enhancement not present over • the ocean • First results at Paramaribo (5°N): • tropical enhancement could not be confirmed in Paramaribo until now


![>> W1=[1 1 1 1;1 -j -1 j;1 -1 1 -1;1 j -1 -j] W1 =](https://cdn1.slideserve.com/3227081/slide1-dt.jpg)