Download
1 / 15
180 likes | 423 Views
Comparison of Pumped and Non-Pumped SBE-41CP CTD Sensors on the Slocum Coastal Electric Glider. Clayton Jones 1 , Scott Glenn 2 , John Kerfoot 2 , Oscar Schofield 2 , Dave Aragon 2 , Chip Haldeman 2 , Dave Pingal 1 1 Teledyne Webb Research Corporation, Falmouth, MA, USA

E N D
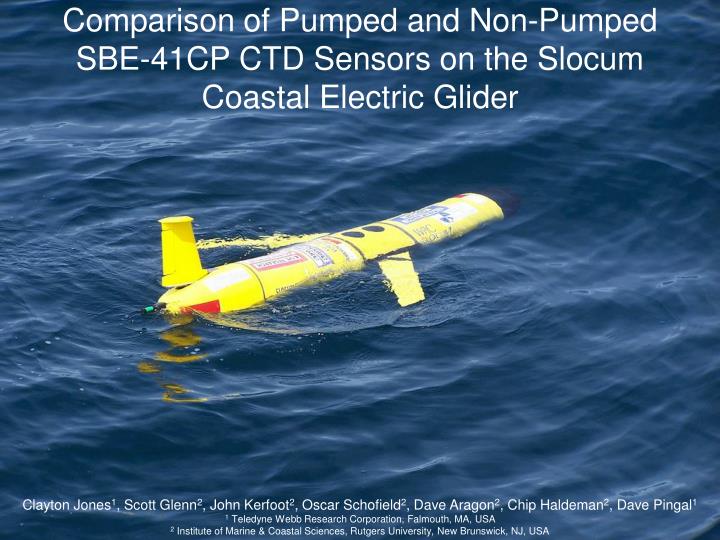
Comparison of Pumped and Non-Pumped SBE-41CP CTD Sensors on the Slocum Coastal Electric Glider Clayton Jones1, Scott Glenn2, John Kerfoot2, Oscar Schofield2, Dave Aragon2, Chip Haldeman2, Dave Pingal1 1 Teledyne Webb Research Corporation, Falmouth, MA, USA 2 Institute of Marine & Coastal Sciences, Rutgers University, New Brunswick, NJ, USA
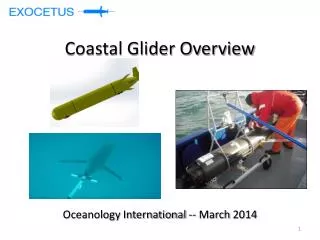
Slocum Coastal Electric Glider • Modular • 3 meters in length • Uses buoyancy to move through the water column in a saw-tooth pattern • RF and satellite communications • Non-pumped SBE-41CP CTD (@ 0.5Hz) • Wide variety of additional payloads • Dissolved Oxygen • Inherent Optical Properties • Chlorophyll a • Colored Dissolved Organic Matter
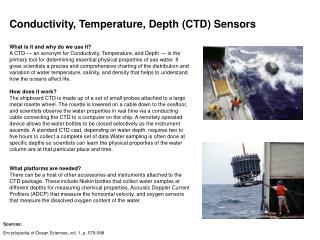
CTD Types: SBE-41CP Current: Non-Pumped Next Generation: pumped
Non-Pumped CTD: Cost/Mechanical Considerations • Lower Power Consumption (~130mW) • Longer Duration Deployments • Requires Less Physical Space • More Space Available for Additional Sensors • Less Expensive
Pumped CTD: Cost/Mechanical Considerations • Higher Power Consumption (~150mW @ 10mL sec-1) • Shorter Duration • Requires More Physical Space • Less Space Available for Additional Sensors • More Expensive (> 2x un-pumped) http://www.seabird.com/pdf_documents/datasheets/GliderCTDPrelimSpec3.pdf
Correction of Raw CTD Profiles: Previous Work • Fofonoff, N. P., S. P. Hayes, and R. C. Millard Jr., 1974: W.H.O.I./Brown CTD microprofiler: Methods of calibration and datahandling. Woods Hole Oceanographic Institution Tech. Rep. WHOI-74-89, 64 pp. • Lueck, R. G., 1990: Thermal inertia of conductivity cells: Theory. J. Atmos. Oceanic Technol., 7, 741–755. • Lueck, R. G. and J. L. Picklo, 1990: Thermal inertia of conductivity cells: Observations with a Sea-Bird cell. J. Atmos. Oceanic Technol., 7, 756–768. • Morison, J., R. Andersen, N. Larson, E. D’Asaro, and T. Boyd, 1994: The correction for thermal-lag effects in Sea-Bird CTD data. J. Atmos. Oceanic Technol., 11, 1151–1164. • Kerfoot, J.K., Glenn, S., Jones, C., 2006: Correction for Sensor Mis-match and Thermal Lag Effects in Non-Pumped Temperature Conductivity Sensors on the Slocum Coastal Electric Glider. Presented Poster at Ocean Sciences 2006. • Johnson, G. C., Toole, J.M., Larson, N.G., 2007: Sensor Corrections for Sea-Bird SBE-41CP and SBE-41 CTDs. J. Atmos. Oceanic Technol., 24, 1117-1130.
RU22/RU23 Glider Deployments: September 2009 Non-pumped CTD: RU22 Segment: ru22_2009_264_1_60 September 26, 2009 14:42 – September 26, 2009 17:42 GMT Pumped CTD: RU23 Segment: ru23_2009_264_1_64 September 26, 2009 23:22 – September 27, 2009 02:24 GMT Selected segments were ~4km apart
Raw CTD Sections Non-Pumped Pumped
Raw CTD Profiles and Means Non-Pumped Pumped
Correction of Raw CTD Profiles: CT Sensor Mismatch • Difficult since CT mismatch offsets are much lower than the nominal sampling frequency (0.5 Hz) of the CTD. Comparison of ΔTemp and ΔCond on upcast and downcast – highly variable! Temperature Alignment
Correction of Raw CTD Profiles: Thermal Inertia • Theory: Within the same water mass and in the absence of internal wave action, 2 consecutive (upcast and downcast) profiles should possess the same hydrographic (T-S) characteristics. • Select 2 consecutive profiles which do not exhibit internal wave activity. • Morison, et.al (1994): TT(n) = -bT(n-1) + a[T(n) – T(n-1)] a = 4fnατ/(1 + 4fnτ) and b = 1 – 2a/α • Vary α and Τ to minimize the area of the polygon formed by joining the resulting salinity profiles. TT(n) = -bT(n-1) + a[T(n) – T(n-1)] a = 4fnατ/(1 + 4fnτ) and b = 1 – 2a/α
Thermal Inertia Results: pumped CTD – Unsmoothed Salinity Density N2
Thermal Inertia Results: pumped CTD - Smoothed Salinity Density N2
Conclusions • Glider vertical velocity and pitch are key factors in any attempt at correcting un-pumped CTD • Vertical velocity and pitch vary significantly, depending on ballast accuracy and water column density. • Pumped CTD provides constant flow which significantly improves success rate of correcting for thermal inertia