Download
1 / 12
120 likes | 213 Views
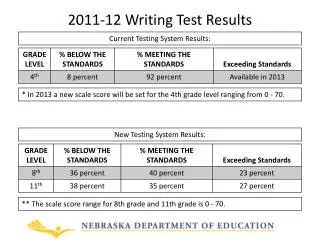
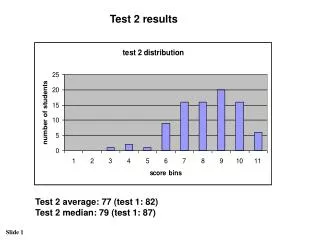
2011 Test Results. CVUSD District Summary. STAR Results. 2011 2010 Subject Advanced/Prof Advanced/Prof ELA (grades 2-11) 76.9 75.4

E N D
2011 Test Results CVUSD District Summary
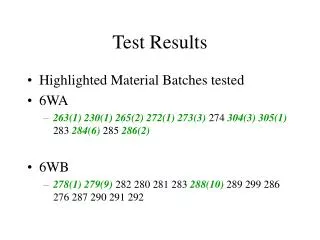
STAR Results 2011 2010 Subject Advanced/ProfAdvanced/Prof ELA (grades 2-11) 76.9 75.4 History (8, 11, EOC) 72 70 Science ( 5, 8, 10) 81.2 78.7
STAR Results 2011 2010 Subject Advanced/ProfAdvanced/Prof Algebra (grade 8): 88 % 88 % Geometry (grade 8): 100 % 100 % Geometry (grade 9): 69 % 70 % Algebra 2 (grade 10): 57 % 55 %
STAR Results 2011 2010 Subject Advanced/ProfAdvanced/Prof Biology (grade 9) 78 % 77 % Biology (grade 10) 69 % 66 % Chemistry (grade 10) 81 % 85 % Physics (grade 11) 99% 91 %
Districtwide 2011 STAR Summary Results for grades 2-11 % Advanced/Proficient • ELA ↑2% • Math ↑1% • History ↑1% • Science CST ↑2.5% • Science EOC ↑1%
2011 STAR RESULTS • More Results • CST Math, Science, & Social Studies increased in every subgroup district-wide • English Learner Subgroup: • ELA: 13.3% (A&P) ⇒ 22.7% • Math: 25% (A&) ⇒ 36.7%
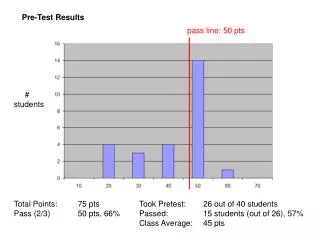
California High School Exit Exam • ELA Passed: 93% Grade 10 Math Passed: 92% Grade 10
2011 API RESULTS • District Highlights • 2011: 876 2010: 866 (+10 points) • All middle schools increased their API – a grand total of 95 points! • 17 Schools increased their API • 7 Schools > 900 • 12 Schools>850 • 7 Schools gained > 15 API Points
AYP • Performance Indicators • Participation Rate : ELA – Yes Math – Yes • API Growth: Yes • Graduation Rate: Yes Target 90% Actual 92.81 • Annual Objectives: ELA – Yes Math – Yes (District wide) ELA – 6 of 9 subgroups – Yes Math – 4 of 9 subgroups – Yes District met 34 of 42 AYP criteria Since not all Annual Objectives achieved, District in Year 2 of Program Improvement per NCLB
New Kindergarten Start Dates • 5 years of age by: