Download
1 / 8
80 likes | 175 Views
Market Analysis and Funding Sources Subcommittee August 9, 2012. Stadium Advisory Committee. Subcommittee Update. Received input from Fort Collins and Denver business communities through Chamber of Commerce surveys and adjusted projections as necessary

E N D
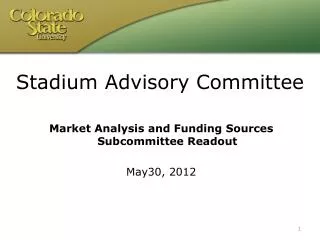
Market Analysis and Funding Sources Subcommittee August 9, 2012 Stadium Advisory Committee
Subcommittee Update • Received input from Fort Collins and Denver business communities through Chamber of Commerce surveys and adjusted projections as necessary • Internal review and modification of financial model to match all recent revisions to the building program • Reviewed historical data and revised model • Internal review of projections and supporting details with CSU-Fort Collins and CSU System financial experts • Presented projections to CSU Board of Governors
Updates to Assumptions • Revised number of priority and premium seating to match both the building program and reflect updated survey results • Scenarios based on percentage sold • Added tailgate revenue line • Added an additional expense line for NSM sponsorship share and an incremental cost to sell sponsorship • Revised Hughes Stadium existing income line
Assumptions Used in Financial Projections CSL has developed 3 potential operating scenarios. Attendance has been inflated by 4 percent per year from Year 1 to Year 5. Attendance remains constant after Year 5.
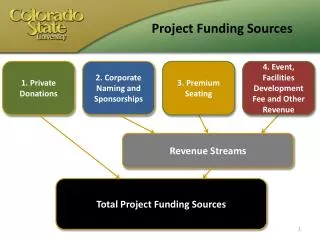
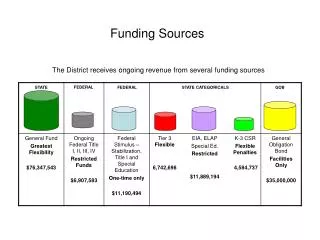
Project Funding Sources 1. Private Donations 2. Corporate Naming & Sponsorships 3. Premium/ Priority Seating 4. Event, Facilities Development Fee and Other Revenue 5. Ticket Revenue 6. Misc. Revenue (concessions, merchandise, tailgate & parking) Financed Revenue Streams Stadium Expenses Total Project Funding Sources University Operating Revenue Streams
Project Funding Sources Private Donations $45M-$220M 2. Corporate Naming & Sponsorships $3.5M-$4.8M 3. Premium Seating $3.7M-$6.7M 4. Event, Facilities Development Fee and Other Revenue $.44M-$1.4M 5. Ticket Revenue $4.3M-$9.8M • Misc. Revenue (concessions, merchandise, tailgate & parking) • $.96M-$3.2M Stadium Expenses Annual: $2.8M-$4M Financed Revenue Streams Annual: $7.6M-$13M Financed: $128M-$217M Total Project Funding Sources $173M-$437M University Operating Revenue Streams Annual: $2.4M-$9M