Download
1 / 10
100 likes | 221 Views
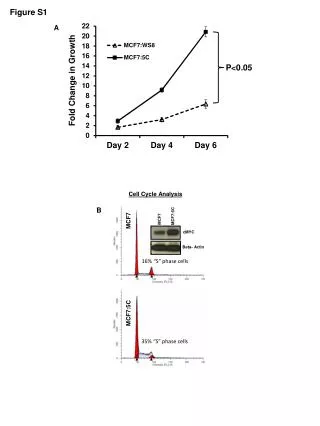
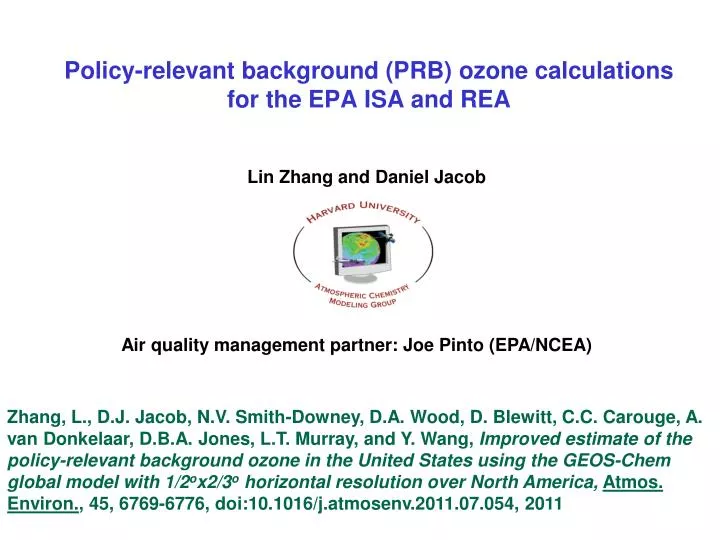
Policy-relevant background (PRB) ozone calculations for the EPA ISA and REA. Lin Zhang and Daniel Jacob. OMI HCHO columns. Jan 2006. Jul 2006. Air quality management partner: Joe Pinto (EPA/NCEA).

E N D
Policy-relevant background (PRB) ozone calculations for the EPA ISA and REA Lin Zhang and Daniel Jacob OMI HCHO columns Jan 2006 Jul 2006 Air quality management partner: Joe Pinto (EPA/NCEA) Zhang, L., D.J. Jacob, N.V. Smith-Downey, D.A. Wood, D. Blewitt, C.C. Carouge, A. van Donkelaar, D.B.A. Jones, L.T. Murray, and Y. Wang, Improved estimate of the policy-relevant background ozone in the United States using the GEOS-Chem global model with 1/2ox2/3o horizontal resolution over North America,Atmos. Environ., 45, 6769-6776, doi:10.1016/j.atmosenv.2011.07.054, 2011
GEOS-Chem nested simulation for North America Color scale Indicates topography (surface pressure) 0.5o x0.67o 2ox2.5o • 0.5o x0.67oresolution for North America, 2o x2.5o global, 48 vertical layers • Driven by NASA GEOS-5 assimilated meteorological data • Detailed mechanistic representation of ozone-NOx-VOC-aerosol chemistry • 2006 anthropogenic emissions: NEI05 for US, CAC for Canada, BRAVO (scaled) for Mexico, EMEP for Europe, Streets for East Asia, EDGAR (scaled) for rest of world • Natural sources: lightning (OTD/LIS), fires (GFED2 monthly), soils (Yienger), stratosphere (Linoz) • 2006-2008 3-year simulation; focus on 2006 for evaluation
Ozone statistics for the US (CASTNet sites) Natural: 18 ± 6 PRB: 27 ± 8 Model: 52 ± 12 Obs: 50 ± 13 + > 1.5 km Frequency distribution of MDA8 ozone for March-August 2006 27 ± 6 • GEOS-Chem is overall unbiased • PRB is 4 ppb higher than in previous GEOS-Chem versions • Model shows little interannual variability for 2006-2008, but neither do observations 40 ± 7 57 ± 10 58 ± 9 Zhang et al. [2011]
Model “4th highest” MDA8 ozone in 2006 Annual 4th highest ozone 4th highest PRB value PRB for annual 4th highest ozone Background may limit or confuse ability of West to achieve a 60 ppb NAAQS; no such issue in East Zhang et al. [2011]
Model PRB statistics vs. observed ozone in Intermountain West Comparison of daily MDA8 ozone concentrations for the ensemble of elevated sites (>1.5 km; 11 sites) in Intermountain West for spring and summer 2006 1:1 line max r = 0.57 r = 0.33 75th 50th 25th min • Model underestimates high extrema in spring (> 75 ppbv) - stratosphere • Correlation with measurements is poor in summer – lightning, wildfires Lin Zhang, Harvard
Model underestimate of stratospheric intrusions in spring Sample stratospheric intrusion at Pinedale (WY) : model captures timing but not magnitude. Obs. model observations PRB stratosphere Observed vs. simulated MDA8 ozone in spring 2006 at the 11 elevated CASTNetsites, colored by model stratospheric ozone concentration. Model has correct STE and vertical transport; we attribute problem to the general difficulty of Eulerian models in resolving fine structures. Lin Zhang, Harvard
Ozone enhancement from lightning in Intermountain West model observations PRB lightning • Model lightning increases ozone concentrations by 7-19 ppbv in summer, comparable to enhancements from US anthropogenic emissions. • This lightning influence in the model is biased high, even though lightning location is constrained by OTD/LIS satellite observations; • focus future model improvement on NOx yield per lightning flash, vertical distribution Lin Zhang, Harvard
Maximum fire enhancements of MDA8 ozone In GEOS-Chem – August 2006 Sensitivity of model ozoneto wildfire emission inventory • Model is highly sensitive to choice of inventory, spatial and temporal resolution • Influence of fires is mainly limited to fire region; little influence at CASTNet sites in 2006 • Need to examine other years, MOPITT and AIRS CO data for fires fire reports monthly Lin Zhang, Harvard
Observed interannual correlation of ozone with wildfiresmay reflect common variation with temperature Ozone correlation with T at elevated CASTNet sites (summer 2006) Correlation of T with PBL depth GEOS-5 Observations Model Subsidence of background air appears to be a major factor driving variability of ozone in the intermountain West Lin Zhang, Harvard
Raluca Ellis and Daniel Jacob (Harvard) Air quality management partner: Bret Schichtel (NPS) New IP: Nitrogen Deposition to US National Parks Motivation: N deposition at some National Parks has reached critical load: changes may not be reversible Nitrogen wet deposition at Rocky Mountain NP is twice the critical load of 1.5 kg N ha-1 a-1 Need to understand where the N is coming from and in what form Approach: Simulate N deposition with nested GEOS-Chem model, evaluate with surface data and OMI NO2 Initial focus on source attribution for RMNP Outcome: Contribute to RMNP Nitrogen Deposition Reduction Plan NH4+ NO3- 1985-2002 trend in wet deposition fluxes (Lehmann et al., 2005)