Download
1 / 70
720 likes | 904 Views
SeVEDS S.M.A.R.T. Comprehensive Economic Development Strategy (SMART CEDS) CEDS Committee Training. January 17, 2013. ViTAL Economy Alliance Frank Knott - fknott@vitaleconomy.com Mark Madsen – mmadsen@priorityone-advisors.com. CEDS Committee Training Agenda.

E N D
SeVEDS S.M.A.R.T. Comprehensive Economic Development Strategy (SMART CEDS) CEDS Committee Training January 17, 2013 ViTAL Economy Alliance Frank Knott - fknott@vitaleconomy.com Mark Madsen – mmadsen@priorityone-advisors.com
CEDS Committee Training Agenda • 11:00 AM – Introduction, Agenda & Initiative Overview, – Frank Knott • 11:20 AM – How we got here…why are we doing a CEDS– Jeff and Laura • 11:40 AM – EDA Requirements and Changes in CEDS Structure – Frank and Mark • 12:00 PM – Review CEDS Best Practice Examples & Performance Metrics – Frank & Mark • 12:30 PM– Working Lunch and Continue best Practice Discussion - All • 1:15 PM– Break • 1:30 PM – Overview & Discussion of S.M.A.R.T. CEDS Process for SeVEDS – Frank & Mark • 2:30 PM – S.M.A.R.T. CEDS Community Engagement Process Overview – Frank • 3:30 PM – Putting it All Together to Achieve Best Practice S.M.A.R.T. CEDS - All • 4:30 PM- Next Steps and Adjourn
Regional CED Strategy Initiative Overview • Initiative Overview Frank Knott ViTAL Economy Alliance
Keys to Regional S.M.A.R.T. CEDS Development & Implementation Process – Based on Best Practices for Regional CED & Collaboration Regional Focus – Enables regions to compete against country strategies Asset-Based – Indigenous assets grow more durable economies Diversified – Makes for a more nimble & resilient economy! Measurable Strategy – Responsive to trends…relevant to region Disciplined & Consistent – All ideas are not equal…priorities matter
ViTAL Economy S.M.A.R.T. CEDS Premise • A CEDS is more than... • a list of projects • a description of the region • generally defined aspirational goals • a task to reach eligibility for federal funding. • A CEDS should be an opportunity to formulate effective strategies that can transform a region’s economy by creating or retaining wealth and increasing prosperity • Effective CEDS strategies must be measureable, accountable to leadership and owned by the region Not all jobs are created equal!
“How We Got to This Extraordinary Point in Time” Jeff Lewis BDCC
Why a CEDS for Southeast Vermont? • Your input: TO DO #1: Confirm SeVEDS Goals and Objectives for undertaking CEDS
Frank Knott ViTAL Economy Alliance Changing CEDS Structure and EDA Requirements
2011 Assessment of EDA’s CEDS Planning Process UPJOHN STUDY PUBLIC COMMENTARY • EDA published an opportunity for the public to comment on EDD/CEDS regulations through a Federal Register Notice. Some ideas received were: • Public Comments on CEDS • Get rid of prescriptive requirements for CEDS Strategy committees • Simplify CEDS requirements by adopting NADO's Peer Standards of Excellence • Update CEDS data sets to measure relevant 21st century global knowledge factors • Either get rid of project list requirement in CEDS or ensure that only projects on CEDS lists are funded • Adopt standards for non-EDA funded CEDS that are consistent with EDA-funded CEDS • Ensure that all implementation projects be tied to a CEDS, make the current project list requirement meaningful • Don't fund projects not in CEDS • Expand list of individuals that can be on the EDD Board • Require coordination with District Organizations for all projects
2011 Assessment of EDA’s CEDS Planning Process UPJOHN STUDY RECOMMEDATION #1 • Increase EDDs’ ability to guide regional • economic development efforts • Encourage EDDs to focus on looking forward to new opportunities and creating strategies • Promote EDD leadership that can express a clear, unified vision based on the region’s strengths • Encourage EDDs to identify and develop clusters driven by innovation and entrepreneurship
2011 Assessment of EDA’s CEDS Planning Process UPJOHN STUDY RECOMMENDATION #2 • Enhance the CEDS • Reduce the size of the document and focus more on strategic development and collaboration to implement regional vision • Discontinue five-year CEDs updated schedule • Make the CEDs planning process annual • Conduct better outreach to increase awareness and the use of the strategy • Partner with EDA University Centers to collect data
2011 Assessment of EDA’s CEDS Planning Process UPJOHN STUDY RECOMMENDATION #3 • Advancing EDA’s relationship with EDDs • More feedback from EDA • Promote best practices • Establish larger regional working groups • Examine how funding applications are handled at the federal level
NADO CEDS Peer Standards • Build more resilient economies and communities by focusing and targeting regional strategies on the existing and potential competitive advantages of each individual region. • Foster a regional collaborative framework to strategically align public sector investments from federal, state and local sources, as well as private, nonprofit and philanthropic partners. • Use modern scenario, data and analysis tools and planning techniques that provide policy makers, stakeholders and the public with evidence-based and factual based information. • Transform the CEDS process into a more strategy-driven planning process focused on regional visioning, priorities setting and performance outcomes, rather than broad-based encyclopedia or narrative of the region with a laundry list of random projects and programs. • Promote and support peer reviews and exchanges of Economic Development District planning professionals and policy officials with the goal of increasing collaboration across EDD boundaries, enhancing organizational resources, and positioning regional CEDS as more effective building blocks for statewide and local strategies. • Communicate in a compelling and modern communication style, including use of executive summaries, high quality print and online media, and social media. • Engage the public, private, nonprofit and educational sectors, along with the general public, in the development and implementation of the CEDS.
Frank Knott & Mark Madsen ViTAL Economy Alliance Best Practice Examples of CEDS Reports and Performance Metrics
CEDS Example #1 – Northland Works Partnership, Minn. • Modern Smart formatting & compelling style of communication • Broad Collaborative Partnership
CEDS Example #1 – Northland Works Partnership, Minn. Clearly defined industry Drivers/Clusters based on regional assets
CEDS Example #1 – Northland Works Partnership, Minn. Clearly defined Action Items
CEDS Example #2 – Southern Tier Regional EDC Newly Established EDC in August 2011 • Modern format and presentation • Good use of graphics to communication their message
CEDS Example #2 – Southern Tier Regional EDC Good use of Issues of Challenge and Opportunity
CEDS Example #2 – Southern Tier Regional EDC Five clearly defined strategies, each with specific actions
CEDS Example #2 – Southern Tier Regional EDC • Each strategy and action item has an associated Implementation Agenda • Lead and partner entities • Resources • Timeframe
CEDS Example #3 – Prosperity Partnership • Prosperity Partnership: Regional Economic Strategy for the Central Puget Sound Region. • Broad Collaboration • Extensive use of modern data, analysis & planning tools
CEDS Example #3 – Prosperity Partnership • Extensive use of graphics mixed with text • Goals (aspirational) and Strategies • Implementation plans • Performance Metrics
CEDS Example #3 – Prosperity Partnership • Targeted industry clusters • Clear implementation plans & responsibilities
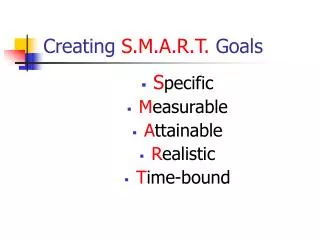
S.M.A.R.T. Goals – Measure the Right Things to Get Better Results Specific Measurable Achievable Relevant Time Based
Why do Performance Metrics Matter? Regional Development Organization • Broader buy in and commitment to the strategy • Improved ability to commutate a methodology, strategy, and priorities • Increased creditability and relevance as a organization • Greater ability to sustain a strategy by using ongoing measurement • Broader investment in regional CED Community • More diverse and balanced economic development approach • More sustainable economy • Faster growing economy due to clear direction and priorities • More attractive economy
Performance Based Metrics • State & Regional Scorecards • Point in time benchmark, without trend analysis • Limited measurements at the County level • Comparison to “like” communities • Core Performance Metrics • Focus on factors that guide wealth creation/retention • Designed to establish job goals at three levels • New high wage jobs • New average wage jobs • Improvement of existing jobs by $5,000/year • Trend Analysis • Benchmarks • 5-year goal setting • On-going measurement • Region Unique Metrics • Directly linked to region unique challenges and opportunities • Informed by elements of Sense of Urgency and Quality of Place
Regional CED Performance Versus Regional CED Best Practices
Regional CED Best Practices – #1-5 • Regional Collaboration: Meaningful & sustainable grass-roots collaboration across public, private, non-profit and traditional political boundaries • Leadership Excellence: Empowers proactive leadership to take ownership of their economy; grows leaders with accountability, authority, legitimacy & transparency • Change Management: Adopts the eight steps critical to managing change into the work plan of each board, committee and action team associated with CED. This will enable the region to more effectively participate and compete in the global economy • Balanced Approach: Integrates economic development, education & workforce development assets with the private sector to build effective knowledge based economic, human capital & quality of place centers of excellence • Asset Based Approach: Identify, connect and leverage tangible and intangible assets to sustainably grow and transform the regional economy
Regional CED Best Practices # 6-10 • Measurable Outcomes: Employs measurable benchmarks, SMART goals and strategies which transform the region through measurable outcomes. ( SMART = Specific, Measurable, Attainable, Relevant, Time Bound) • Innovation Driven: Builds innovation ecosystems that create a lasting regional climate of opportunity, entrepreneurship, risk taking and innovation • Life Cycle Finance: Provides access to a life cycle of funding as well as equity and debt financing to sustain regional public, private & non-profit ventures • Regional Brand Promise: Defines, creates, communicates and delivers on a clear brand promise that promotes & sustains regional competitive advantages • Regional Transformation Mindset: Sustains commitment to CED as a journey that is a marathon not a sprint, and is transformative not incremental
Collaboration Best Practices – #1-4 • Recognizes & accepts need for collaboration: Potential partners need to recognize their interdependence. Structural, procedural, financial, professional barriers need to be identified and minimized where feasible • Understands & respects partner’s capabilities and limits: All parties need to appreciate and respect the others’ background, experience, needs, capabilities, motivations, expectations, and goals. • Executive Commitment and Ownership: Partnerships can only succeed with the consistent and sustainable commitment of key public and private sector executives, which promotes “ownership” within their organizations. • Clear working relationships & lines of accountability: Partnerships need clear and simple “terms of engagement.” Decision-making process must be transparent. Roles, responsibility, and lines of accountability must be clear.
Collaboration Best Practices – #5-8 • Goals and outcomes must be clear & transparent: Goals and objectives must be “SMART.” Risks, rewards, and expected benefits/outcomes should also be specific and measurable. SMART = Specific, Measurable, Attainable, Relevant, Time-Bound • Uses effective, accurate, consistent, open & clear communications: Collaborative efforts are dependent upon open and clear communication both internally and externally. • Develops & maintains trust: Developing and maintaining trust is the basis for the closest, most enduring and most successful working arrangements. • Measures, Monitors, Learns and Adapts: Evaluation and review are an integral part of any management process. They are essential to monitor progress related to the group’s goals & objectives, making modifications and cementing commitment and trust.
Community Economic Development Readiness Assessment The CED Readiness Assessment is an honest self-assessment facilitated by VE during the Kickoff Event week. The final report includes recommendations and actions to close gaps in regional CED delivery. Who from SeVEDS, BDCC, WRPC, etc. should participate? EXAMPLE
Mark Madsen via WebEX Overview and Discussion of S.M.A.R.T. CEDS Process
SeVEDS CEDS Committee Roles See Handout Documents • Committee Roles • S.M.A.R.T. CEDS Table of Contents TO DO #2: Confirm official CEDS Committee membership via SeVEDS Board action
S.M.A.R.T. CEDS Four Milestone Process and Schedule CEDS Kick-off Event Town Hall Meeting • Kickoff • CEDS Committee Training • Existing Research • Sense of Urgency • Issues of Challenge & Opportunity • Economic Benchmarking & S.M.A.R.T. Goal Setting • Community Engagement Plan • CEDS Objectives • CED Readiness Assessment • Discovery • Four (4) Open Public Input Events (March) • Four (4) Community Report Back Events (May) • Focus Interviews • Media Campaign • Begin Analysis of community input • Connect • Analyze Community Input • Prioritize Strategies • Identify & Prioritize Targeted Industry Clusters • Prioritize Critical capital project • Identify partners • Develop Implementation Plan • Report • Prepare /Review Draft CEDS • Town Hall Meeting to open 30-day public comment period • Finalize CEDS • Adopt CEDS • Submit CEDS to EDA To Do #3: Set Bi-Weekly SeVEDS Staff / VE Conference Call Schedule
Mark Madsen via WebEX Examples of Economic Benchmarking and Regional Profile
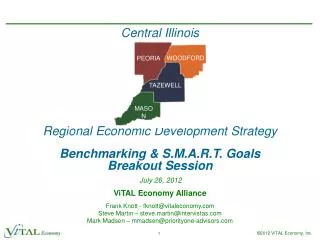
Industry Sectors Focus Forward CI 2017 Regional Goals Forestry 2017 Pop. target 386,475 (2010 Census 375,218) 13,190 new jobs: (1,319 Jobs @ $53,715/yr) (11,841 Jobs @ $48,832/yr) Improvement of 19,456 existing jobs by $5,000/yr Ramp up Educational Attainment Bachelor & Graduate Degrees (25 & over) 2012 est. 68,719 2013 69,919 (+1200) 2014 71,219 (+1300) 2015 72,769 (+1550) 2016 74,669 (+1900) 2017 76,969 (+2300) Increase Pop of 25-44 agefrom 25% to 30% of total Pop. Reduce families in Poverty by 10% Agriculture Healthcare Tourism Information Tech Education Manufacturing Energy Balanced Strategic Approach – Central Illinois Goals Inform Strategic Components CEDS Planning Business Retention & Expansion Business Recruitment Business Incubation Leadership Training Strategy Action
S.M.A.R.T. Goals Development Process & Framework • Benchmark • Trend analysis • Goal setting • Measurement Core Performance Metrics Development Steps Region Unique Metrics Primary Issues of Challenge & Opportunity Strategy Specific Metrics Strategy & Action
EXAMPLE Southern Illinois = Benchmark, High Poverty Primary Issues of Challenge & Opportunity Source: IL Poverty Summit, “2004 Report on Illinois Poverty,” Based on US 2000 Census or IL Dept of Employment Security data & Atlas of Illinois Poverty Spring 2003
EXAMPLE Maine = Trend Analysis, Aging Population Age Demographic Trends, 2003 - 2028 35-54 • 2013-2028 • Population Change • -107,980 • 0-54 0-19 Primary Issues of Challenge & Opportunity • 54+ • +90,826 20-34 64+ 55-64 Maine is already the “oldest state” in the U.S. and facing an acceleration of decline in all ages except for 64+ starting in 2018 This will threaten the viability of the Maine economy and quality of life
Existing Regional Benchmark Reports Can Provide a Solid Foundation to Build Key Performance Metrics
Benchmark: Maine’s GDP EXAMPLE • Key Trend Factors: Real GDP • 2009 Maine GDP = $66.4B • GDP Growth Rate • 2004–2009 2009-2010 • US 5.7% 2.6% • NE 3.9% 3.4% • Maine 1.4% 2.1% Graphic Source: Maine Measures of Growth in Focus, 2011 Maine Goal GDP growth outpace NE and US GDP growth rate >4.2% Equals $1.35B over trend $50,376 → $51,400 per capita GDP Data: NNE Economic Scenario Model, 2009 data - 2011 dollars
Core Performance Metrics Measureable Economic Vision • Population • Employable Population • Labor Participation Rate • Total Employed • Average Wage • Total Region Wages • Per Capita Income • Regional GDP • Bachelors Degrees 25+ Target Job Goals New jobs at 110-115% of average wage New jobs at new average wage Improvement of existing jobs by $5,000/yr
Core Performance Metrics EXAMPLE NEW JOBS: 3,109 WAGE: $51,750$160.8m NEW JOBS AT AVERAGE WAGE: 2,072 WAGE: $45,000 $93.2m IMPROVEMENT OF EXISTING JOBS: 10,928 WAGE: $5,000 $54.6m CLIMATE OF ECONOMIC OPPORTUNITY: $681.4m 2007-2015 CPI-W Inflation Assumption: 3.08%/year
Core Performance Metrics EXAMPLE
Region Unique Metrics 2012 Goals: 25-to-85%Broadband Coverage 12-to-54% Penetration • COI Results (2006-2007): • Created a demand driven customer aggregation model generating thousands of open-access sales leads (www.iwantmybroadband.com) • Over 35+ small towns have received broadband • Over $24M+ in new private sector broadband infrastructure • Reached 16% Penetration and 41% Broadband Coverage after only 18 months
Strategy Specific Metrics Aroostook County Renewable Energy Economy Strategic Elements INNOVATION UMPI, UMFK, UMaine & NMCC must lead in the develop of R&D and workforce training programs attracting young thinkers and linking to regional industry FINANCE The region must develop an integrated finance structure to supply specialty forms of financing for energy efficiency modifications and heating system conversions CONNECTIVITY The region must be leading the US in the availability and 24x7 boundary free uses and access to broadband services VALUE ADDED PROCESSING Pellet and Chip manufacturers converting biomass for forest and farm into heating fuel material. Distribution systems deliver product to consumer. NATURAL RESOURCE Forest and Farm biomass resources form the foundation of this industry in Aroostook County Aroostook Renewable Energy Economy ENTREPRENUERSHIP The region must embed a climate of entrepreneurship from grade school education to community leaders MARKETING & COMMUNICATIONS A strategic and consistent internal and external communication plan must be implemented to promote the use of Aroostook energy products and resources INDUSTRY NETWORKS Informal and formal industry networks must be create locally, regionally, nationally and globally