Download
1 / 45
470 likes | 677 Views
Quality Improvement in Behavioral Health Care: Concepts and Tools. In preparation for the New Jersey Statewide Behavioral Health Care Quality Improvement Fair. Shula Minsky, Director, Quality Improvement, UBHC minsky@umdnj.edu. Training Objectives. Review quality improvement (QI) principles

E N D
Quality Improvement in Behavioral Health Care: Concepts and Tools In preparation for the New Jersey Statewide Behavioral Health Care Quality Improvement Fair Shula Minsky, Director, Quality Improvement, UBHC minsky@umdnj.edu
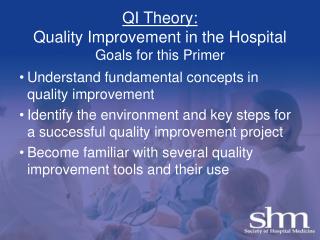
Training Objectives • Review quality improvement (QI) principles • Describe, and ‘walk through’ the quality improvement process • Examine QI tools and how & when to use them • Practice the development and presentation of a QI project for the inaugural QI Fair of 2010
The G A P Quality improvement is... A systematic approach to analyzing (current) performance in an organization WHAT IS QUALITY IMPROVEMENT ? What should BE What IS AND designing, testing and monitoring interventions that bridge the gap
A FEW IMPORTANT PRINCIPLES • Continuous improvement must be high priority for all • Quality improvement is a team effort • Focus of improvement is on process, not individuals • Quality improvement must be data-driven • The QI Process is best when based on an established, accepted model. • The QI Process information must be communicable… (documentation is essential).
A GENERAL MODEL FOR QUALITY IMPROVEMENT Why do this (performance GAP!)? What are the objectives? Does it fit overall mission, values, plans? Who needs to participate? What are the expected results? What exactly will we do? For how long will we engage in this activity? How will wemeasure baseline performance? How will we measure outcome? How will we communicate our results? PLAN If it works, implement, disseminate, publicize, do training and in-service, and maintain gains. DESIGN IMPROVE MEASURE ASSESS Implement your interventions, Collect relevant baseline and outcome data, analyze, compare with past performance and with external resources. Evaluate the results, interpret, discuss, is the new process/ strategy/improvement useful? practical? cost-effective?
Data Collection “Collecting data is much like collecting garbage…….. You must know in advance what you are gonna do with the stuff.” Mark Twain
Collecting Data Consider: • What really needs to be measured? • What’s the best way to measure it? • How much data needs to be collected, for how long, and how often? • How will the data be used? • if you cannot answer this question, don’t collect this information
Collecting Data Practical suggestions: • Use (if possible) currently collected data, it will • help pinpoint your problem and the purpose of your QI team • provide ready-made baseline and outcome measures • If you have to use other measures, choose a tested and proven instrument • If you can’t find what you need, develop your own measure (very carefully) • Look for simple, concrete counts of things and events
Overview of useful QI tools What they are. When and How to do them. Process tools: • Brainstorming • Multi-voting • Pareto Charts • Cause & Effect Diagrams (“Fishbone”) • Flow Charts Data display tools: • Run Charts and Control Charts Work Plans and project tracking
Brainstorming: Select a problem • When embarking on a new project, and no one knows where to go and what to do • When the team is “stuck” in the same old way of doing things and you want an influx of new, creative ideas • When you want to have all members involved, and avoid having the group dominated by a few vocal members WHEN: WHAT: A formalized way to generate ideas efficiently and creatively and get all team members involved in the process. UTILITY/PURPOSE: • Used to identify topic/problem for improvement at the planning stage, generate ideas about possible/probable causes of problems, or ideas for interventions.
Brainstorming (cont.) HOW: • Structured: each team member gives an idea in turn • A variant: members write ideas on cards • Unstructured: team members give ideas as they come to mind • Use flipchart/large paper, write all ideas • Do not discuss. Do not agree/disagree. Do not criticize(only allow clarification questions) • When new ideas are exhausted, stop
Multi-Voting: Prioritize WHAT: A way to build team consensus by incorporating individual preferences/ratings into the overall team decision WHEN: When you need to reach consensus, but team members seem torn between competing options. Can be done to finalize priority issues after brainstorming (topics/problems, causes, interventions, etc.)
Multi-Voting: Prioritize HOW: • List all the options on a flipchart • Eliminate duplicates, or group similar items, clarify meanings where/if necessary • Give each statement an identifier (a, b, c, etc.) • Decide how many votes each member would have (3-5 is usual) • Each team member (independently) places his/her votes on an index card • Cards are collected, votes tallied on flipchart/large paper
Pareto Chart: Display Priorities WHAT: A way to display the magnitude/importance of some problems/issues or to prioritize potential causes of identified problems • WHEN:When you wish to: • focus efforts on tasks that have the greatest potential impact • shift focus away from someone’s “pet peeve” to the real issues • provide a simple picture, easy to understand and communicate, regarding the relative importance of specific issues/solutions • display the results of multi-voting ( on your poster…)
Pareto Chart (cont.) HOW: • Determine the categories related to your issue (e.g., different QI topics, probable causes) • Determine your unit of measurement (e.g., number of votes, percent of votes, etc.) • Collect the data (if you don’t already have it) • Count the units of measurement per category, and plot the highest one first, the second highest second, etc. (use PPT…)
Use the Process Tools to Identify Probable Causes of Your Problem • Brainstorm the probable causes of the problem you identified • Prioritize the causes using multi-voting • Display your results in a Pareto chart (you have 10 minutes to do it…)
WHAT:A formalized way to describe and prioritize potential causes to an identified problem that: • focuses on thespecific problemto be fixed • creates asnapshotof collective knowledge around a problem • focuses on potentialcauses, not symptoms • helps direct your attention topossible interventions Cause & Effect Analysis:“Fishbone” Diagram • WHEN:When you need: • a simple, graphical way to explore and communicate possible causes for anidentified problem • to facilitatefocusing on the main issuesthat need corrective action
Cause & Effect Analysis:“Fishbone” Diagram • HOW: • Work as a team • Use a skeleton of a fishbone diagram (see handout) • Place the identified problem in the box on the right • Decide on the major cause categories, and place them at the top of the main “bones”(don’t plan on more than six) • Brainstorm possible causes and place them all on the draft
A Fishbone Diagram Staff Process Environment The problem High no-show rates Equipment Training Patient
HOW • learn a few symbols ... can do by hand (but do not have to…) • have input from all stakeholders • do several drafts • get consensus from all involved Flow Charts What: A formalized way to describe a process or an event • WHEN When you need to: • understand what happened • streamline a process • design an intervention (in the right place) • show change from past to the present • share understanding about a specific event or process
Direction of flow Start/End Activity Decision point Report Computer file Flow Chart Symbols Alert: possible breakpoint
Flow Chart: Start: you want to cook special dinner An example Look for recipe book Scream in frustration Have all ingredients? Yes No Is it on the shelf? Yes No Scream in frustration Find the book! Yes Get your spouse to buy what you need Are stores open? No Yes Cook dinner Did he get all? Smile, The End No Scream in frustration Cry, The End
Flow Chart: Guidelines • Don’t be concerned about defining the process/event completely in the first draft • Involve people who are familiar with the process/event • Review the flow chart for accuracy and completeness (several times) • It is useful to create the “as is” before you attempt to do the “as it should be”
Improvement Planning Milestones Beforeimplementing the intervention, the team should have: • Clarified/specifiedthe problemin need of improvement • Established abaselinemeasurement • Identified at least oneprobable significant cause • Consideredseveralpossible interventions that address the identified cause • Selected asmall setof interventions to start with
Implementing Improvement • Your interventions do not have to address ALL problems everywhere to be effective Implement in small doses • Monitor, measure and share even small performance improvements with peers, build acceptance and alliances Sustainable improvement takes time
Displaying Outcomes: Run Chart WHAT:Charting a specific measure over time. For example, number of no-shows or restraints by quarter, number of falls by month, number of phone calls per day, number of BMI (BP) documented by month. • WHEN:When you want to: • monitor performance to detecttrends or shifts,over time • compare a measurebefore and afteran intervention • focus attention onchanges in the processunder scrutiny
Displaying Outcomes: Run Chart • HOW: • Select a performance measure • Gather enough data points (at least 20-30) • Create a graph with timeline on the horizontal axis (x axis) and the measure on the vertical (y axis) • Plot the data points and connect them with a line (or use PowerPoint to do it for you) • Calculate the mean for the measure and draw the line in your graph
Run Chart Example Seclusion rates in Adolescent Inpatient settings July 98-December 02
Control Chart HOW: • Develop a run chart, ensure you have enough data points • Calculate and plotthe mean(central line) • Calculate thestandard deviation (SD) • Add 1 SD to the mean to plot theupper control limit • Subtract 1 SD from the mean to plot thelower control limit • Add 2 SD to the mean to plot the high upper (2 SD) control limit WHAT: A way to look at run charts and facilitate recognition of meaningful variation. WHEN: When you monitor ongoing performance measures and need to have a quick way to recognize trends or shifts that are meaningful or significant.
Control Chart Seclusion rates in Adolescent Inpatient settings July 98-December 02 High upper control limit (2SD) Upper control limit (1SD) Mean Lower control limit (1SD)
Work Plans and Project Tracking
Document your QI team Process ( if it was not documented, it was not done…) • Have a clear and consensual definition of yourpurpose(write it down…) • Develop awork plan,with specific tasks, responsibilities, and timeline (modify and revise as you go along) • Have designatedminutes-taker(you can rotate the honor…) andfacilitator(should be two different people)
Document your QI team process (cont.) • Circulate minutes to members within a day or two (keep it fresh…) • Keep all draftsused in your deliberations (brainstorming lists, fishbone diagrams, flow charts, Pareto charts, multi-voting results, baseline data, etc.)
WORK PLANS : Two Examples What Who t1 t2 t3 t4 t5 t6 t7 t8 t9 t10 Task 1 Task 2 Task 3 Task 4 What Who Due date Status (as of) Start date Task 1 Task 2 Task 3 Task 4
Guidelines for Your Poster Presentation… • Use fewer words, more pictures; if you use words, use large print • Make thepresentationcolorful,vivid,interesting… (but don’t go overboard...) • Include enough detail to tell the story, but not too much (you will have a handout with details for those who are interested) • Plan your space well
Guidelines for Poster Presentation… (cont.) • Include in your poster: • The purpose of your project • Team members and their affiliation • Steps of the QI model you have used • Methods used to select topic, and achieve consensus on causes and interventions • A (short) description of your interventions • Baseline and outcome data • Conclusion/status/plans for the future
Guidelines for your Oral Presentation… • Do not read from your summary page (everyone knows how to read) • Keep it short, and stick to the main points • Keep eye contact with the audience, don’t hesitate to express your enthusiasm • Consider your presentation an infomercial, a marketing tool to whet audience appetite for more
Now is your chance… To critique someone else’s QI process Each table will receive one actual case, presented in past QI Fairs Your task: • First, review the poster presentation and summary page according to the criteria we discussed (10 minutes) • Second, have one member provide a 2-minute oral presentation of your group’s findings.
The Third Statewide QI Fair of 2013 June 20, 2013 • Letter-of-intent due on March 30, 2013 (fax to QI Department, 732.235.3922) • If you have questions or need consultation regarding general issues or statistics, please e-mail qiquestions@umdnj.edu • Final project: Poster and one-page summary due to QI at UBHC on May 28, 2013 • Guidelines for the one-page summary and the project judging criteria on the next slide.
The Third Statewide QI Fair of 2013 June 20, 2013