Download
1 / 42
470 likes | 850 Views
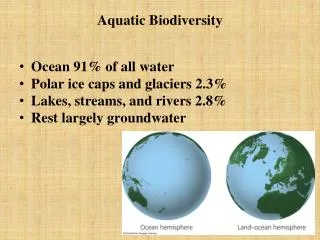
Aquatic Biodiversity. Aquatic Systems. Coverage of the Earth :. 71% of the earth is covered by salt water, 2% fresh water Aquatic life zones are the equivalent of terrestrial biomes Distribution of life determined by salinity

E N D
Coverage of the Earth: • 71% of the earth is covered by salt water, 2% fresh water Aquatic life zones are the equivalent of terrestrial biomes • Distribution of life determined by salinity • Saltwater (marine): oceans, estuaries, coastal wetlands, shorelines, coral reefs, mangrove • Freshwater: lakes, rivers, wetlands
Levels of Life Plankton: • Phytoplankton; a 1° producer, includes algae • Zooplankton; 1° consumers • Ultraplankton; photosynthetic bacteria Nekton: • Strong swimming consumers (fish, turtles, whales) Benthos: • Bottom dwellers; oysters, clams, crabs, worms
Levels of Life Decomposers • Mainly bacteria Key factor in types and numbers: dO2 food, light, nutrients
Importance of Marine Life Zones Ecological and Economic Resources • Coastal Zone: warm, nutrient-rich • Continental Shelf: contains 90% of marine species; • Important for commercial fisheries; • High NPP
Estuaries & Coastal Wetlands Estuary: where river meets ocean; fresh & salt water mix • Coastal wetlands associated w/ estuaries • Very productive ecosystems • Seagrass beds are another impt component • Mangrove forests can also be found here
Estuaries & Coastal Wetlands Ecological & Economic Importance: • Filter toxic pollutants • Provide food, habitats, nursery sites • Reduce storm damage
Salt Marshes • Found along the coast in temperate climates and contain non woody emergent vegetation. • The salt marsh is one of the most productive biomes in the world
Mangrove Swamps • Found along tropical and subtropical coasts and contain trees whose roots are submerged in water. • Mangrove trees are salt tolerant and help protect the coastlines from erosion and storm damage
Shore Lines Intertidal Zones • Organisms must survive extremes in water levels and salinity Rocky Shores • Pounding waves, pools offer refuge; organisms hang on, dig in or hide in shells Barrier (sandy) Beaches • Dunes offer storm protection; organisms burrow or tunnel
Coral Reefs • Found in warm, shallow waters beyond the shoreline. • Earth's most diverse marine biome even though coral reefs are found in water that is relatively nutrient-poor. • Coral bleaching- algae inside the coral dies. Most likely due to a combination of disease and environmental change.
Open Sea/Ocean Floor Euphotic Zone • Upper zone; photosynthetic; large predatory fish Bathyal Zone • Middle zone; dimly lit; zooplankton & small fish that migrate to photic zone to feed Abyssal (Aphotic) Zone • Dark, cold, low O2, marine snow, deposit feeders, low NPP/area; overall - large
Disruption of Marine Systems In a nutshell: • Coastal development • Overfishing • Runoff • Point source pollution (sewerage) • Invasive species • Climate change
Chesapeake Bay • Huge population growth • Huge drainage basin – acts as a big sink • Phosphate & nitrate levels ↑; which leads to algal blooms and O2 depletion • Overfishing • Chesapeake Bay Program of 1983 – Integrated Coastal Mgmt program: land use regs, banning PO4’s, upgrading sewerage treatment
Chesapeake Bay • 100 years ago: oysters cleaned water every 3 days • Introducing Asian oysters is being considered • From 1985 – 2000, PO4 levels ↓ 27%, nitrogen levels ↓ 16% • Still a long way to go
Streams & Rivers • Flowing fresh water • Originate from springs or runoff • Rapid flow = few producers; rely on terrestrial biomes (leaves) for nutrients • Slow rivers: nutrients settle and provide substrate for plants • Rapids: high O2 content
Water Flow Watershed • Land area that delivers runoff , sediment, and dissolved substances to a stream/river Source Zone • Headwaters, mountain stream; cold and fast-moving
Water Flow Transition Zone • Wider, deeper, slower; supports producers → flood plain Flood Plain Zone • Slow, warmer, muddy; contains backwaters; → deltas
Standing or Flowing • Lentic = standing water • Lotic = flowing water • Lakes form from glaciation, crustal displacement, volcanic activity
Streams & Rivers • Flowing fresh water • Originate from springs or runoff • Rapid flow = few producers; rely on terrestrial biomes (leaves) • Slow rivers: nutrients settle and provide substrate for plants • Rapids: high O2 content
Lakes and Ponds • Contain standing water • Divided into distinct zones: • Littoral Zone: shallow area of soil & water near shore; rooted plants, photosynthesis • Limnetic Zone: rooted plants cannot survive; phytoplankton photosynthesize • Profundal Zone: deep lakes; low O2 due to decomposers; muddy bottom: benthic zone
Lakes and Ponds Four zones: • Littoral: near shore, very diverse • Limnetic: open sunlit sfc layer; photosynthetic, plankton, large fish • Profundal: deep, open water, ↓ O2 • Benthic: bottom; decomposers, detritus feeders, small fish
Nutrients and Succession Oligotrophic • Small supply of plant nutrients; deep water, steep sides Eutrophic • Well-nourished, established; shallow, turbid, high NPP • Cultural eutrophication comes from human input; can lead to hyper-eutrophic conditions
Inland Wetlands Nature’s sponges! Marsh: grasses, reeds, few trees Swamp: trees and shrubs Prairie potholes: depressions carved by glaciers Floodplains
Inland Wetlands Services: • Filter and degrade toxins • ↓ flooding and erosion • Replenish stream flows • Recharge aquifers • Maintain biodiversity • Valuable products • Recreation
Disruption & Degradation • 95% of US wetlands are inland • About half of the original wetlands are gone (since the 1600’s) • 80% of those due to agriculture • Loss contributes to extremes – flood/drought
Disruption & Degradation Dams and canals fragment Flood control levees and dikes disconnect rivers from floodplains Cities and farms pollute and add excess nutrients Drainage and filling