Download
1 / 1
10 likes | 100 Views
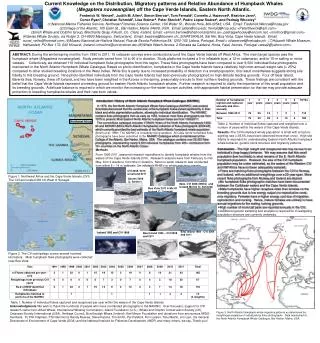
Uncertainty Analysis with Data-Model Assimilation at Duke FACE. GPP. Leaves X1. Woody X2. Fine Roots X3. Metabolic Litter X4. Structural Litter X5. Microbes X6. Slow SOM X7. Passive SOM X8. Introduction

E N D
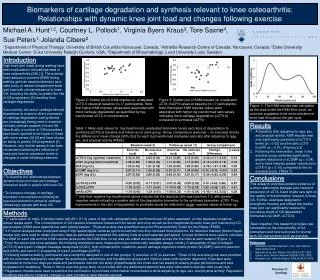
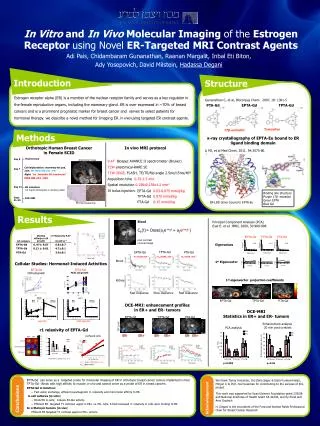
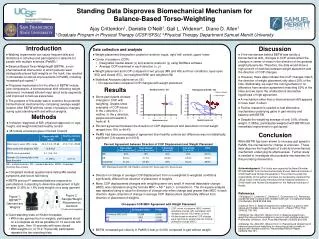
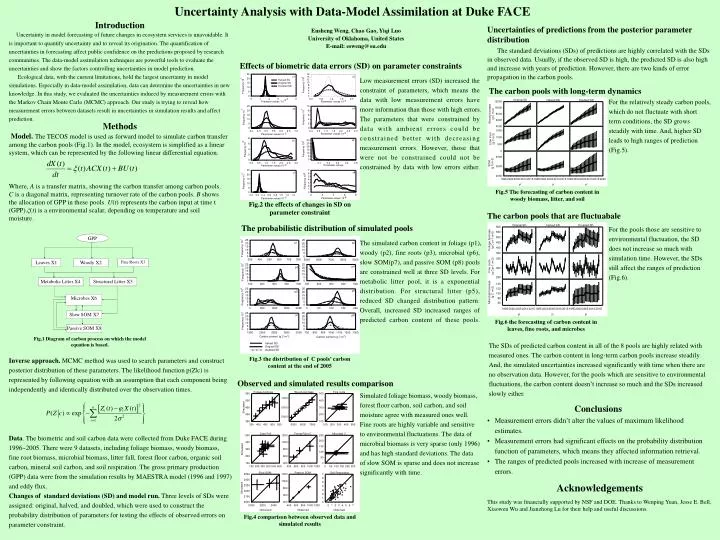
Uncertainty Analysis with Data-Model Assimilation at Duke FACE GPP Leaves X1 Woody X2 Fine Roots X3 Metabolic Litter X4 Structural Litter X5 Microbes X6 Slow SOM X7 Passive SOM X8 Introduction Uncertainty in model forecasting of future changes in ecosystem services is unavoidable. It is important to quantify uncertainty and to reveal its origination. The quantification of uncertainties in forecasting affect public confidence on the predictions proposed by research communities. The data-model assimilation techniques are powerful tools to evaluate the uncertainties and show the factors controlling uncertainties in model prediction. Ecological data, with the current limitations, hold the largest uncertainty in model simulations. Especially in data-model assimilation, data can determine the uncertainties in new knowledge. In this study, we evaluated the uncertainties induced by measurement errors with the Markov Chain Monte Carlo (MCMC) approach. Our study is trying to reveal how measurement errors between datasets result in uncertainties in simulation results and affect prediction. Uncertainties of predictions from the posterior parameter distribution Ensheng Weng, Chao Gao, Yiqi Luo University of Oklahoma, United States E-mail: esweng@ou.edu The standard deviations (SDs) of predictions are highly correlated with the SDs in observed data. Usually, if the observed SD is high, the predicted SD is also high and increase with years of prediction. However, there are two kinds of error propagation in the carbon pools. Effects of biometric data errors (SD) on parameter constraints Low measurement errors (SD) increased the constraint of parameters, which means the data with low measurement errors have more information than those with high errors. The parameters that were constrained by data with ambient errors could be constrained better with decreasing measurement errors. However, those that were not be constrained could not be constrained by data with low errors either. The carbon pools with long-term dynamics For the relatively steady carbon pools, which do not fluctuate with short term conditions, the SD grows steadily with time. And, higher SD leads to high ranges of prediction (Fig.5). Methods Model.The TECOS model is used as forward model to simulate carbon transfer among the carbon pools (Fig.1). In the model, ecosystem is simplified as a linear system, which can be represented by the following linear differential equation. Where, A is a transfer matrix, showing the carbon transfer among carbon pools. C is a diagonal matrix, representing turnover rate of the carbon pools. B shows the allocation of GPP in these pools. U(t) represents the carbon input at time t (GPP).ξ(t) is a environmental scalar, depending on temperature and soil moisture. Fig.5 The forecasting of carbon content in woody biomass, litter, and soil Fig.2 the effects of changes in SD on parameter constraint The carbon pools that are fluctuabale The probabilistic distribution of simulated pools For the pools those are sensitive to environmental fluctuation, the SD does not increase so much with simulation time. However, the SDs still affect the ranges of prediction (Fig.6). The simulated carbon content in foliage (p1), woody (p2), fine roots (p3), microbial (p6), slow SOM(p7), and passive SOM (p8) pools are constrained well at three SD levels. For metabolic litter pool, it is a exponential distribution. For structural litter (p5), reduced SD changed distribution pattern. Overall, increased SD increased ranges of predicted carbon content of these pools. Fig.6 the forecasting of carbon content in leaves, fine roots, and microbes Fig.1 Diagram of carbon process on which the model equation is based. The SDs of predicted carbon content in all of the 8 pools are highly related with measured ones. The carbon content in long-term carbon pools increase steadily. And, the simulated uncertainties increased significantly with time when there are no observation data. However, for the pools which are sensitive to environmental fluctuations, the carbon content doesn’t increase so much and the SDs increased slowly either. Fig.3 the distribution of C pools’ carbon content at the end of 2005 Inverse approach. MCMC method was used to search parameters and construct posterior distribution of these parameters. The likelihood function p(Z|c) is represented by following equation with an assumption that each component being independently and identically distributed over the observation times. Observed and simulated results comparison Simulated foliage biomass, woody biomass, forest floor carbon, soil carbon, and soil moisture agree with measured ones well. Fine roots are highly variable and sensitive to environmental fluctuations. The data of microbial biomass is very sparse (only 1996) and has high standard deviations. The data of slow SOM is sparse and does not increase significantly with time. • Conclusions • Measurement errors didn’t alter the values of maximum likelihood estimates. • Measurement errors had significant effects on the probability distribution function of parameters, which means they affected information retrieval. • The ranges of predicted pools increased with increase of measurement errors. Data. The biometric and soil carbon data were collected from Duke FACE during 1996~2005. There were 9 datasets, including foliage biomass, woody biomass, fine root biomass, microbial biomass, litter fall, forest floor carbon, organic soil carbon, mineral soil carbon, and soil respiration. The gross primary production (GPP) data were from the simulation results by MAESTRA model (1996 and 1997) and eddy flux. Changes of standard deviations (SD) and model run. Three levels of SDs were assigned: original, halved, and doubled, which were used to construct the probability distribution of parameters for testing the effects of observed errors on parameter constraint. Acknowledgements This study was financially supported by NSF and DOE. Thanks to Wenping Yuan, Jesse E. Bell, Xiaowen Wu and Jianzhong Lu for their help and useful discussions. Fig.4 comparison between observed data and simulated results