Download
1 / 12
130 likes | 197 Views
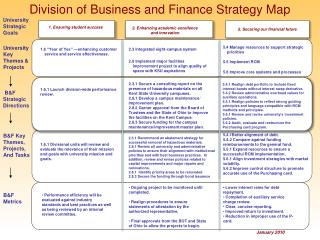
FINANCE MAP. By Gaylen K. Bunker. Objectives of Workshop. Principles: Time lag between investment and return. Compounding versus Summing Value = Discounted future cash flows. Decisions: Convert into today’s dollars Discount rate = Cost of Capital Finance focus on Cash Flows

E N D
FINANCE MAP By Gaylen K. Bunker
Objectives of Workshop Principles: • Time lag between investment and return. • Compounding versus Summing • Value = Discounted future cash flows. • Decisions: Convert into today’s dollars • Discount rate = Cost of Capital • Finance focus on Cash Flows • Cost & Return are the same thing.
CAPITAL FUNCTIONS Income Statement Operating Revenue Expense Profit A/R & Inv A/P $ Financing Liabilities & Equity Operate PP&E Investing Balance Sheet
Financing Decisions Income Statement Operating Revenue Expense Profit A/R & Inv A/P $ Financing Liabilities & Equity Operate PP&E Investing Balance Sheet
Financing Decisions Return Income Statement Capital Structure Financial Leverage Risk and Return Trade-off Risk D E Revenue Expense Profit Cost of Capital WACC $ Financing Cost of Debt (Interest) Liabilities & Equity Cost of Equity (Stock) Dividend Discount Model (Dividend Yield & Growth) Capital Asset Pricing Model (Risk-free rate, Beta, Market Return)
Investing Decisions Income Statement Operating Revenue Expense Profit A/R & Inv A/P $ Financing Liabilities & Equity Operate PP&E Investing Balance Sheet
Investing Decisions Income Statement Capital Budgeting Capital Rationing FCF Free Cash Flow Inv Revenue Expense Profit Net Present Value Internal Rate of Return Metrics Profitability Index Operate PP&E Payback Investing Inv Inv Inv Inv Inv
Operating Decisions Income Statement Operating Revenue Expense Profit A/R & Inv A/P $ Financing Liabilities & Equity Operate PP&E Investing Balance Sheet
Operating Decisions Income Statement Operating Revenue Expense Profit A/R & Inv A/P EBIT Working Capital Operating Leverage Credit Management Financial Ratios NOPAT Free Cash Flow Days Sales Outstanding Capital Charge Just-in-time Systems Economic Value Added Cash Discounts
Valuation Decision Free-Cash-Flow; Net Invested and Operating Capital Income Statement WACC; and Future Growth Operating Revenue Expense Profit A/R & Inv A/P $ Financing Liabilities & Equity Operate PP&E Investing Balance Sheet Time Value of Money; Present Value; Future Value; & Annuities
VALUE = Future Free Cash Flows Summarized in Today’s Dollars 2007 2008 2009 2010 2011 2012 2003 10 20 25 30 30 20 9.09 16.53 18.78 20.49 18.63 11.29 94.81
Fundamental Building-blocks FV = PV x (1 + r) PV = FV / (1 + r)