Download
1 / 70
700 likes | 708 Views
Inequality Measurement. Inequality measurement Measurement Technical University of Lisbon Frank Cowell http://darp.lse.ac.uk/lisbon2006. July 2006. Issues to be addressed. Builds on lecture 3 “Distributional Equity, Social Welfare” Extension of ranking criteria Parade diagrams

E N D
Inequality Measurement Inequality measurement Measurement Technical University of Lisbon Frank Cowell http://darp.lse.ac.uk/lisbon2006 July 2006
Issues to be addressed • Builds on lecture 3 • “Distributional Equity, Social Welfare” • Extension of ranking criteria • Parade diagrams • Generalised Lorenz curve • Extend SWF analysis to inequality • Examine structure of inequality • Link with the analysis of poverty
Major Themes • Contrast three main approaches to the subject • intuitive • via SWF • via analysis of structure • Structure of the population • Composition of Inequality measurement • Implications for measures • The use of axiomatisation • Capture what is “reasonable”? • Find a common set of axioms for related problems
Inequality measurement Overview... Inequality rankings Inequality measures Relationship with welfare rankings Inequality axioms Inequality decomposition Inequality in practice
Inequality rankings • Begin by using welfare analysis of previous lecture • Seek inequality ranking • We take as a basis the second-order distributional ranking • …but introduce a small modification • The 2nd-order dominance concept was originally expressed in a more restrictive form.
Inequality rankings • Using the welfare analysis above… • Seek an inequality ranking • Take as a basis the 2nd-order distributional ranking • …but introduce a small modification • Normalise by dividing by the mean • Away of forcing an “iso-inequality” path as mean income changes • The 2nd-order dominance concept was originally expressed in this more restrictive form…
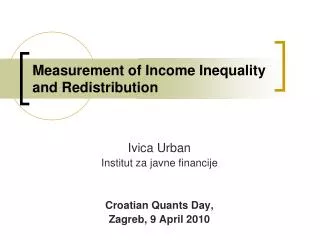
Yet another important relationship • The share of the proportion q of distribution F is given by L(F;q) := C(F;q) / m(F) • Yields Lorenz dominance, or the “shares” ranking G Lorenz-dominates Fmeans: • for every q, L(G;q) ³L(F;q), • for some q, L(G;q) > L(F;q) • The Atkinson (1970) result: For given m, G Lorenz-dominates F Û W(G) > W(F) for all WÎW2
The Lorenz diagram 1 0.8 L(.; q) 0.6 L(G;.) proportion of income Lorenz curve for F 0.4 L(F;.) 0.2 practical example, UK 0 0 0.2 0.4 0.6 0.8 1 q proportion of population
Application of ranking • The tax and -benefit system maps one distribution into another... • Use ranking tools to assess the impact of this in welfare terms. • Typically this uses one or other concept of Lorenz dominance.
Official concepts of income: UK original income + cash benefits gross income - direct taxes disposable income - indirect taxes post-tax income + non-cash benefits final income What distributional ranking would we expect to apply to these 5 concepts?
Assessment of example • We might have guessed the outcome… • In most countries: • Income tax progressive • So are public expenditures • But indirect tax is regressive • So Lorenz-dominance is not surprising. • But what happens if we look at the situation over time?
1.0 0.9 0.8 0.7 0.6 0.5 0.0 0.1 0.2 0.3 0.4 0.5 “Original income” – Lorenz • Lorenz curves intersect • Is 1993 more equal? • Or 2000-1?
Inequality ranking: Summary • Second-order (GL)-dominance is equivalent to ranking by cumulations. • From the welfare lecture • Lorenz dominance equivalent to ranking by shares. • Special case of GL-dominance normalised by means. • Where Lorenz-curves intersect unambiguous inequality orderings are not possible. • This makes inequality measures especially interesting.
A further look at inequality • The Atkinson SWF route provides a coherent approach to inequality. • But do we need to approach via social welfare • An indirect approach • Maybe introduces unnecessary assumptions, • Alternative route: “distance” and inequality • Consider a generalisation of the Irene-Janet diagram
Inequality measurement Overview... Inequality rankings Inequality measures • Intuition • Social welfare • Distance Three ways of approaching an index Inequality axioms Inequality decomposition Inequality in practice
An intuitive approach • Lorenz comparisons (second-order dominance) may be indecisive • But we may want to “force a solution” • The problem is essentially one of aggregation of information • Why worry about aggregation? • It may make sense to use a very simple approach • Go for something that you can “see” • Go back to the Lorenz diagram
The best-known inequality measure? 1 0.8 proportion of income 0.6 Gini Coefficient 0.5 0.4 0.2 0 0 0.2 0.4 0.6 0.8 1 proportion of population
The Gini coefficient • Equivalent ways of writing the Gini: • Normalised area above Lorenz curve • Normalised difference between income pairs.
Intuitive approach: difficulties • Essentially arbitrary • Does not mean that Gini is a bad index • But what is the basis for it? • What is the relationship with social welfare? • The Gini index also has some “structural” problems • We will see this in the next section • What is the relationship with social welfare? • Examine the welfare-inequality relationship directly
Inequality measurement Overview... Inequality rankings Inequality measures • Intuition • Social welfare • Distance Three ways of approaching an index Inequality axioms Inequality decomposition Inequality in practice
SWF and inequality • Issues to be addressed: • the derivation of an index • the nature of inequality aversion • the structure of the SWF • Begin with the SWF W • Examine contours in Irene-Janet space
xj xi Equally-Distributed Equivalent Income • The Irene &Janet diagram • A given distribution • Distributions with same mean • Contours of the SWF • Construct an equal distribution E such that W(E) = W(F) • EDE income • Social waste from inequality • Curvature of contour indicates society’s willingness to tolerate “efficiency loss” in pursuit of greater equality • E • F O m(F) x(F)
Welfare-based inequality • From the concept of social waste Atkinson (1970) suggested an inequality measure: Ede income x(F) I(F) = 1 – —— m(F) Mean income • Atkinson assumed an additive social welfare function that satisfied the other basic axioms. W(F) = òu(x) dF(x) • Introduced an extra assumption: Iso-elastic welfare. x1 - e– 1 u(x) = ————, e ³ 0 1 – e
The Atkinson Index • Given scale-invariance, additive separability of welfare • Inequality takes the form: • Given the Harsanyi argument… • index of inequality aversion ebased on risk aversion. • More generally see it as a stament of social values • Examine the effect of different values of e • relationship between u(x) and x • relationship between u′(x) and x
Social utility and relative income U = 0 4 3 = 1/2 2 = 1 1 = 2 = 5 0 1 2 3 4 5 x / m -1 -2 -3
Relationship between welfare weight and income =1 U' =2 =5 4 3 2 =0 1 =1/2 x / m =1 0 0 1 2 3 4 5
Inequality measurement Overview... Inequality rankings • Intuition • Social welfare • Distance Inequality measures Three ways of approaching an index Inequality axioms Inequality decomposition Inequality in practice
A distance interpretation • Can see inequality as a deviation from the norm • The norm in this case is perfect equality • Two key questions… • …what distance concept to use? • How are inequality contours on one level “hooked up” to those on another?
Another class of indices • Consider the Generalised Entropy class of inequality measures: • The parameter a is an indicator sensitivity of each member of the class. • a large and positive gives a “top -sensitive” measure • a negative gives a “bottom-sensitive” measure • Related to the Atkinson class
Inequality and a distance concept • The Generalised Entropy class can also be written: • Which can be written in terms of income shares s • Using the distance criterion s1−a/ [1−a] … • Can be interpreted as weighted distance of each income shares from an equal share
The Generalised Entropy Class • GE class is rich • Includes two indices from Henri Theil: • a = 1: [ x / m(F)] log (x / m(F)) dF(x) • a = 0: – log (x / m(F)) dF(x) • For a < 1 it is ordinally equivalent to Atkinson class • a = 1 – e . • For a = 2 it is ordinally equivalent to (normalised) variance.
Inequality contours • Each family of contours related to a different concept of distance • Some are very obvious… • …others a bit more subtle • Start with an obvious one • the Euclidian case
GE contours: a < 2 a = 0.25 a = 0 a = −0.25 a = −1
GE contours: a limiting case a = −∞ • Total priority to the poorest
GE contours: another limiting case a = +∞ • Total priority to the richest
By contrast: Gini contours • Not additively separable
Inequality measurement Overview... Inequality rankings Inequality measures A fundamentalist approach Inequality axioms Inequality decomposition Inequality in practice
A further look at inequality • The Atkinson SWF route provides a coherent approach to inequality. • But do we need to approach via social welfare • An indirect approach • Maybe introduces unnecessary assumptions, • Alternative route: “distance” and inequality
x j x k x i The 3-Person income distribution Income Distributions With Given Total ray of Janet's income equality Karen's income 0 Irene's income
x j x k x i Inequality contours • Set of distributions for given total • Set of distributions for a higher (given) total • Perfect equality • Inequality contours for original level • Inequality contours for higher level 0
Themes • Cross-disciplinary concepts • Income differences • Reference incomes • Formal methodology
Methodology • Exploit common structure • poverty • deprivation • complaints and inequality • see Cowell (2005) • Axiomatic method • minimalist approach • characterise structure • introduce ethics
“Structural” axioms • Take some social evaluation function F... • Continuity • Linear homogeneity • Translation invariance
Structural axioms: illustration • D for n=3 • An income distribution • Perfect equality • Contours of “Absolute” Gini • Continuity • Continuous approach to I = 0 • Linear homogeneity • Proportionate increase in I • Translation invariance • I constant x2 x* • 1 • x3 0 x1
Amiel-Cowell (1999) approach • The Irene &Janet diagram xj • A distribution • Possible distributions of a small increment ray of equality • Does this direction keep inequality unchanged? Janet's income • Or this direction? • Consider the iso-inequality path. • Also gives what would be an inequality-preserving income reduction • A “fair” tax? C B A xi 0 Irene's income
xj xi Scale independence • Example 1. • Equal proportionate additions or subtractions keep inequality constant • Corresponds to regular Lorenz criterion
xj x 2 xi Translation independence • Example 2. • Equal absolute additions or subtractions keep inequality constant