Download
1 / 43
430 likes | 602 Views
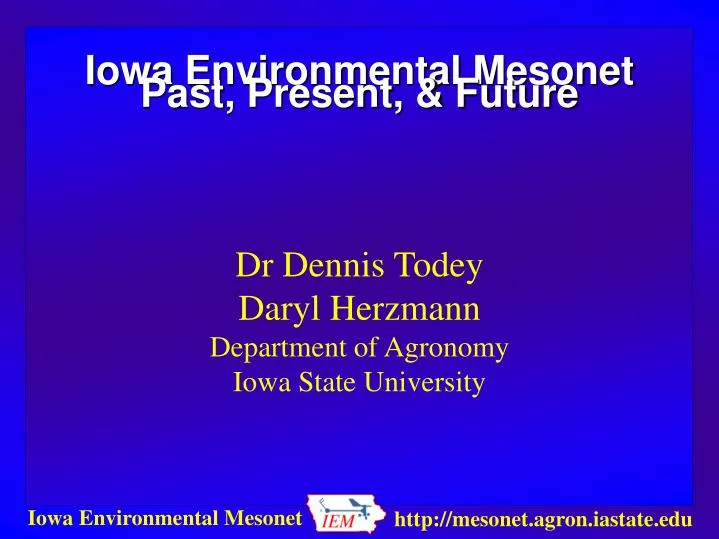
Iowa Environmental Mesonet Past, Present, & Future. Dr Dennis Todey Daryl Herzmann Department of Agronomy Iowa State University. Seminar Outline. IEM Past Background information Building the IEM IEM Present Current impacts in the state and the nation Status of project areas IEM Future

E N D
Iowa Environmental MesonetPast, Present, & Future Dr Dennis Todey Daryl Herzmann Department of Agronomy Iowa State University
SeminarOutline • IEM Past • Background information • Building the IEM • IEM Present • Current impacts in the state and the nation • Status of project areas • IEM Future • Potential partnerships • Augmenting networks
ASOS Network • Larger Airports • 15 sites • Flagship network • 1+ obs per hour
AWOS Network • 37 Sites • 4 of them just recently added VTI,MPZ,PEA,IIB • FOD and CWI are really ASOSish • 3 obs per hour
NWS COOP • ~160 sites in Iowa. • Report 1x or 2x per day • 'Official' observations of climate
DCP / USGS • > 150 stations • Mostly river gauges, some have atmos • Report every 15-60 minutes, but delayed.
ISU Ag Climate Network • 12 sites located at ISU Exp farms • Report hourly, but delayed by one day • Additional soil sensors will be added soon.
DOT RWIS • 50 (48) sites located along roadways • 4 obs per hour • Pavement and bridge deck sensors
Soil Climate Analysis Network • 2 sites in Iowa • Shagbark Hills was recently added. • 1 ob per hour • 5 soil levels • (High-end ISUAG stations)
KCCI SchoolNet • Currently, 44 sites. • ~400 obs per hour • Instantaneous winds • Very cool applications.
KELO SchoolNet • Currently, 14 sites • Recently added on 12 Sept 2002 • ~400 obs per hour • 5 sites without humidity sensors
Recent Conferences • NCAR: 'GIS in Weather, Climate and Impacts' • 12-14 August 2002 -- Boulder, Colorado • Presented on the IEM's GIS efforts and sat on a discussion panel. • Barons RADAR Training Conference • 23-25 August 2002 -- Huntsville, Alabama • Presented on IEM work with KCCI's SchoolNet. • Overwelming response.
IEM & GIS • Firstly, what is GIS? • 'Geographic Information Systems' • What is it though? • GIS is not ESRI, but ESRI is a GIS. • My definition, 'Intelligent Spatial System' • While most people can't agree on a definition, they can look at a system and deem it as a GIS.
IEM GIS Efforts • Web Applications • Built on MapServer • Backend data accessed via PostGIS database • GIS Datasets • Current school network conditions • NEXRAD imagery shapefiles, geo-referenced images • NWS COOP Climate data
Ex 1. Where's it raining? • Current NEXRAD base reflectivity • 15 minute schoolNet precip totals shown • GIS Layers • Counties / States • NEXRAD image • SchoolSites (Spatial DB)
Ex 2: Spatial Precip Viewer • Qualitative comparison of NEXRAD precip and observations. • Incorperates many GIS layers. • Provides links at the bottom to GIS datasets.
Ex 3: NEXRAD imagery with warnings • Real-time ingestion of warnings into Spatial DB. • Plots both county based and polygon based warnings. • Zoomable and Queriable.
Ex 4: Iowa Tornado Database • Historical tornado reports are mined in the database. • The dataset is querible and visualized with the help of GIS!
Ex 5: Pretty Plots • With the help of PHP Mapscript, plots such as this one are a breeze! • This plot was dynamicallly generated based on stations of the users choice.
(Things that give me headaches and make me lose sleep at night.) IEM Laundry List
Averaging the schoolNet winds Wind data sampled every minute Wind data averaged every minute. (roughly 10 obs)
AWOS Precipitation The observation at :45 after is sent in the METAR report. The actual total at :55 after is never reported. The result is that precip data from 10 minutes out of every hour is not reported. This is roughly a 17% under-estimation. Clarinda's (ICL) precip counter resets at :45 after, so METAR precip from the site is not missing data.
Missing AWOS Data • Around midnight, the DOT's mainframe goes offline for backups. • So does the AWOS data feed. • This data is never recovered in the METAR feed.
NWS Coding standards • 'More than 50% of NWS severe weather Watch, Warning, and Adisory products contain coding or formatting errors' - A. Marvin McInnis • Some ASOS Daily Summary Messages (DSM) are not given a correct WMO header, thus the products are dropped at the NWS Gateway. • NWS COOP reporting is done on a per-WFO basis. The reported SHEF data is sent with much different meanings.
COOP RTP Data Reports • Des Moines, LaCrosse • DH07/TX/TN/PP • Sioux Falls • RTP product is not SHEF encoded. RR1-3 come in with meaningful timestamps • Davenport • DH07/TAIRZX/TAIRZN/PPDRZZ/SFDRZZ/SDIRZZ • Omaha • DH07/TAIRZX/TAIRZN/PPD/SF/SD
IEM Tracker • Built on Portfolio. • Tracks meta-data about IEM sites. • Tracks trouble tickets for site repairs and offline status alerts. • Integrated with the mesonet via the database.
Example IEM Tracker Alert Date: Mon, 16 Sep 2002 07:21:12 -0500 From: Iowa Environ Mesonet <mesonet@mesonet.agron.iastate.edu> To: akrherz@iastate.edu Subject: [IEM] Council Bluffs (I-80) Online ############################################ # Iowa Environmental Mesonet # # - RWIS Network Station Status # ############################################ Council Bluffs (I-80) is back Online! Great! Last Observation was received at: 2002-09-16 12:07:04.00 GMT Trouble Ticket ID: 1255 has been cleared.
IEM Tracker Impacts • In 3 months, IEM Tracker has generated ~1200 trouble tickets!!! • ~2,400 emails sent to network admins and site contacts. • ~2,800 pieces of meta-data entered into the database. • Provides excellent proof of site problems. • Observing network reliability has increased for every network using IEM Tracker.
Interactive Plotting Fun. • The IEM utilizes a dynamic PHP plotting package called JpGraph to generate most of its interactive plots.
WAP IEM • Building mechanisms to place IEM data on cell-phones, PDAs, GPS units. • Focus of providing just-in-time data for decision support.
Future/Continuing Efforts • IEM-DataVision • All in one, data viewing/dl/comparing application • QUALITY CONTROL • Visually on plots and flags in datasets • Web-site streamlining • IEM-Freeze • Multi-sensor, GIS based, freezing rain identification • GIS, GIS, GIS
Future Conferences. • 21-24 October 2002 • National Weather Association Conference • Will receive the 'Larry R Johnson' award for significant contributions to operational Meteorology. • 9-13 February 2003 • American Meteorological Society Annual Meeting • Will present at the first GIS focused session of the IIPS conference
Questions? Daryl Herzmann akrherz@iastate.edu 3015 Agronomy Hall 515.294.5978


![The ONCE and FUTURE [e-] JOURNAL](https://cdn0.slideserve.com/1357417/the-once-and-future-e-journal-dt.jpg)