Download

1 / 134
1.35k likes | 1.55k Views
Unit 2: Demography (Population Studies). Implications of Population growth. Real Time Population Statistics @ http://www.worldometers.info / The World at Seven Billion @ http://www.youtube.com/watch?v=sc4HxPxNrZ0 The World’s Most Typical Person @ http://www.youtube.com/watch?v=4B2xOvKFFz4

E N D
Implications of Population growth Real Time Population Statistics @ http://www.worldometers.info/ The World at Seven Billion @ http://www.youtube.com/watch?v=sc4HxPxNrZ0 The World’s Most Typical Person @ http://www.youtube.com/watch?v=4B2xOvKFFz4 Hans Rosling explains population growth and its implications using legos @ http://www.youtube.com/watch?v=SxbprYyjyyU
I. Population Statistics • 1st question: “Where is the data coming from?” After all, Figures don’t lie, but the liars can figure! • Basic terminology: What does correlation mean???
Correlation Coefficient • Measures how related 2 variables are • Shown as #s b/t +1 and -1 • Determines: • STRENGTH • Closer to 1/-1 = strong correlation • Closer to 0 = weak/no correlation • DIRECTION (positive or negative) • Determined through statistical magic!
Practice determining Strength… Which is stronger? A. -.8 or +.5 B. .2 or - .3 C. .9 or .1 D. .5 or -.52 E. -.9 or .9
Let’s look at Scatter Plots(they show the variables being measured) • Remember, close to zero = weak relationship/unrelated variables • Ask yourself: Is it going NE or SE? • NE = “Positive” = both variables increase OR both decrease (“direct relationship”) • SE = “Negative” = One variable increases other decreases (“inverse relationship”) • Correlations do NOT = causation!!!
TRUE or FALSE • If there seems to be no spatial relationship among the plots than there is a very weak or insignificant relationship among the two variables. • If the plots all fall along an imaginary line except for one, then the relationship has to be strong. • If all the plots fall along an imaginary line the relationship is 1.0, or close to 1.0.
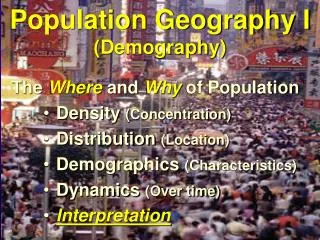
Slight positive correlation: .42
10 Questions • Positive or negative correlation? Strong or weak? • Identical twins’ IQ scores? • Age and wealth? • Caloric intake to weight? • Affluence and family size • Geographical knowledge and sexiness? • AP Human Geo GPA and score on AP Exam • Alcohol Intake and balance/consciousness LOL • Sarcasm in answers and Exam Scores?? • Washing hands and likelihood of getting swine flu? • Next scatter plot… what correlation coefficient would you expect?
Let’s relate this to something that affects you… • What do colleges look at when you apply? • What is the relationship b/t the almighty GPA and college success (freshman year GPA) • How about the ALMIGHTY SAT score and college success??? • Actual statistics: .48 and .42 respectively • What about combined? ONLY .55!! Surprised??? • Why are freshmen so unpredictable??
Question? If they really have no clue who will succeed and who will not, why use these statistics for admittance into colleges?
Why and how did the College Board change the SAT a few yrs. ago? According to the College Board…Did the changes to the SAT impact its predictive validity? • Our expectations are that the predictive validity of the total test will increase modestly with the addition of writing as a third measure of students' critical thinking skills. In a recent validity study, the SAT Subject Test in Writing was judged to be the best single test in predicting freshman grade point average for all ethnic/racial groups except Asian Americans. In that same study, adding SAT Writing Subject Test scores to SAT scores added .02 to .03 incremental validity above SAT and high school grades. Another study, conducted by the University of California, showed the Writing Subject Test added .06 to.08 to the overall predictive validity, while the most recent study indicates that it added .02 for students in most majors except those in education; for those students, the increment rose to about .06.
QUIZ TIME!!! No Talking!
1. Birth Rate (CBR) • Calculated how? • High =40+ Low = <15 • Wealth and CBR • Positive/negative correlation? • Exceptions: China (12) E. Europe (12)Low wealth and low CBR. Otherwise, high wealth, low CBR. • Highest: Chad (51) and Niger (50) • Lowest: Germany/Bosnia/Japan @ 8 • U.S.: 13 • World average = 20 • MDCs = 11, Dev = 22, w/o China = 25, LDCs = 34
2. Death Rate (CDR) • Calculated? • High = 18 Low = <10 • Stat can change dramatically • War, pandemic, famine, etc. • W. Hem in 16th Century was 900/1,000 • Correlation Wealth and CDR? • NOT Really? • Highest: Sierra Leone (18) & E. Europe ~15 • Lowest: U.A.E (1) and Qatar & Oman (2) • U.S.: 8
3. Natural Rate of Increase (NRI) or (RNI) • Calculated how? • Ex: CBR 20 CDR 5 THEN NIR = 15/1000 = 1.5% • High = 2-3% Low = Less than 1% • USA formula CBR 13.8 minus CDR 8.4 = 5.4/1,000 = .54% • Europe: Denmark, Finland, Iceland, Ireland, Norway, Sweden, U.K., Belgium, France, Luxembourg, Netherlands, Switzerland, Albania, Kosovo, Spain have slightly pos, NRI. A number of others have a 0 or negative NRI. Why? Highest in world = Niger.
4. Population growth rates (PGR) • Calculated how? • High = 2+% Low = <1% or negative • U.S.: 13.8 (CBR) – 8.4 (CDR) + Net migration 4.3 (per 1000) = 9.7/1000 = .97% • Population Growth trends • Negative/Positive Correlations? • Women’s rights Impact of immigration? • Economic growth • Literacy rate
5. Total Fertility Rates (TFR) (ages 15-49???) • 2.5 for the world today • 8.1 highest in history • 2.33 stability = “replacement rate” • 2.1 in industrialized nations • 2.5+ in peripheral country • Why not 2.0? • Mortality rates of women before they can have children • Comparisons: • High: Niger (7.6), Chad (7.0), Somalia (6.8) (a lot of babies!!) • U.S.: 1.9 • Low: Singapore (1.3) Taiwan & South Korea (1.3) • Lower fertility rates: Cause for optimism?
Singapore Social Development Unit 1984(started) 2006(changed) • to improve the social networking between busy working individuals • organize activities for its members http://www.myspaceanimations.com/myspace-animations-heart-graphics.html
Social Development Unit “Dare to Date" http://healthscreeningpackagessingapore.com/ “The Chemistry Guide: When Boy Meets Girl”, '' focusing on the overworked, the shy, and the "cosmetically challenged." The guide reminds hopeful singles that "Skin-care products are must-have investments" and "There's no bigger turnoff than a foul mouth, reeking with leftovers from lunch!" 2 free publications
Population Policies http://www.monochrom.at/english/2008/04/demographic-winter.htm What types of population policies exist ?
Maintenance or Stability 2 babies .1 + http://www.yooj.co.uk/test_page_1.html http://www.visualphotos.com/image/2x4628085/russian_babys_feet_sticking_out_from_blanket
2009 • 36countries have pro-natalist policies • 67 countries have anti-natalist policies • 33 countries have maintenance policies
*Why would a country want a pro-natalist policy ? • replaces those lost in war and civil unrest • build up the military • replace retiring folks in the workforce • support the increasing number of seniors • occupy parts of a country that are virtually empty • help develop the resources of a state • lead to economic growth • increase majority/minority percentages • gain more influence internationally
Examples: of Pro-natalist Policies Past and Present http://www.imb.org/southern-africa/images/Malagasy_children.jpg
U.S.S.R. 1944 – 1992 awarded medals to women in order to encourage a high fertility rate. Why ?
3 Categories of Medals were Presented • Motherhood Medals • Order of the Glory of Motherhood or Order of Maternal Glory • Order of Mother Heroine
Motherhood Medals 2nd Class 1st Class 5 children 8,000,000 awarded 6 children 4,000,000 awarded
Order of Maternal Glory 3rd Class 2nd Class 1st Class 7 children - 2,000,000 awarded 8 children - 1,000,000 awarded 9 children - 500,000 awarded
Order Mother Heroine 10 children 200,000 awarded
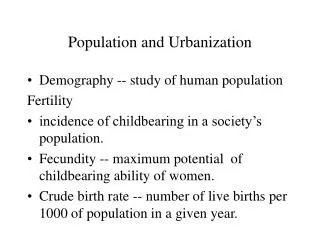
Germany Cross of Honor of the German Mother http://nobeliefs.com/mementoes.htm 1938 - 1944
http://www.diggerhistory.info/pages-medals/nazi2.htm Bronze 3rd Class Mother’s Nazi Cross 4, 5 Silver 2nd Class Mother’s Nazi Cross 6, 7 Gold 1st Class Mother’s Nazi Cross 8 or more Diamond – 14 or more ?
German Mother’s Cross 14 children ? 17 diamonds http://snyderstreasures.com/pages/motherscross.htm
Russia Recent incentives 2008Year of the Family http://www.farfrommoscow.com/articles/songs-for-russias-day-of-family-fidelity-and-love.html
RussiaRecent incentives continued July 8 new national holiday – Day of Family, Love, and Fidelity • earlier births • stable families – reduce divorce rate, revive family values • promote patriotism – babies for Russia A 3rd child means wealth will be tripled in the third millennium. http://somatosphere.net/2011/12/%E2%80%98population-prescriptions%E2%80%99-pronatalism-and-the-fear-of-underpopulation-in-post-soviet-russia.html • “Give me Life Campaign” • medals for long married couples with children (~ 25 years)
Ulyanovsk Oblast, Russia - Family Contact Day (Conception Day) http://www.msnbc.msn.com/id/20268426/ns/world_news-europe/t/russians-offered-day-prizes-procreate/ Grand Prize winners of “Give Birth to a Patriot on Russia’s Independence Day” Contest
Japan Princesses Masako & Aiko
Japan Government Incentives • improved parental leave (1 yr. @ 66.7%) • local govn’ts (rural) cash bonuses • monthly allowance (~ 300/child) • New Angel Plan (more available daycare & less working hours) • free pre-natal care and deliveries http://factsanddetails.com/japan.php?itemid=600&catid=18 Companies are urged to have family-friendly packages • monthly payments (Matsushita) • shorter hours (Nippon Telegraph & Telephone) • fertility treatments paid for (Canon) • $400 (1st) - $40,000 (5th) (Softbank) • $1000 – 1st, $2000 – 2nd, $20,300 for 3rd + (Koei Tecmo )
Iran Anti-natalist or pro-natalist ? 1967 – first anti-natalist policy 1979 – pro-natalist 1988 – anti-natalist 2006 – pro-natalist Why ?
1979 • start of Islamic Revolution • family planning program – western influence • promotion of contraception by health officials banned • procreation to bolster the ranks of “soldiers for Islam” (8 year war with Iraq) http://www.fnb.to/FNB/Article/Khomeyni/Khomeiny3.jpg Ayatollah Khomeini
Khomeini’s pro-natalist policy resulted in GR of 3.2% Total fertility rate rose to 7
2006 http://www.msnbc.msn.com/id/38434672/ns/world_news-mideast_n_africa/t/iran-will-pay-new-babies-boost-population/ “I am against saying that two children are enough. Our country has a lot of capacity. It has the capacity for many children to grow in it. It even has the capacity for 120 million people. Westerners have got problems. Because their population growth is negative, they are worried and fear that if our population increases, we will triumph over them.” Iranian President Mahmoud Ahmadinejad