Download
1 / 12
120 likes | 199 Views
Land Use Analysis. An important aspect of any GIS is the use of analysis. Analysis helps us to say something meaningful about the work that we have done, and it makes the work uniquely ours. Paper maps have been made for years, but it’s your work that creates a unique GIS.

E N D
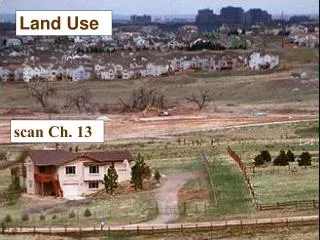
Land Use Analysis An important aspect of any GIS is the use of analysis. Analysis helps us to say something meaningful about the work that we have done, and it makes the work uniquely ours. Paper maps have been made for years, but it’s your work that creates a unique GIS. In this section, we are going to work through some analysis of your school and the way that the land is used on your campus. For this, we will need both GeoMedia and Excel.
Land Use on Campus Your final task is to create a pie chart to show the relative amount of land on campus dedicated to various functions.
2. Create a table in Excel resembling the one above. Now open your GeoWorkspace. 1. For this exercise you will need to open Microsoft’s Excel spreadsheet application in addition to your workspace in GeoMedia.
3. Next, you’re going to tell GeoMedia to create a new attribute showing the area of each feature. Click on the “Analysis” menu, and then “Functional Attributes”. 4. Start by selecting “building” under “School Features” as the feature class to which you will add a functional attribute.
5. Click the “New” button to add a functional attribute. 6. Type in the name “Area” for this particular functional attribute.
7. To begin defining your function, click on “Geometry” under Categories. Then, under Functions, double-click on “AREA” to add it to your expression. Finally, under Attributes, double-click on “Input.Geometry” to tell GeoMedia to calculate area on your building geometries. 8. Type a comma on the keyboard, so that it appears after “Input.Geometry”. Now go back to the Categories column and click on “Constants”. Scroll down in the middle column and double click on “ProjectedMeas”, and then type another comma. In the same middle column, scroll down just a little further and double-click on “Acre”. Your completed expression should read: AREA(Input.Geometry,ProjectedMeas,Acre) If you need to, you can type directly in the Expressions window. You’ll know if it’s correct if the word “Double” appears in the Output Type field. Click the “Add” button, then the “Close” button.
9. Functional attributes produce “queries”. Let’s call this one “building with Area”. Make sure you uncheck the box for “Display functional attributes in map window”, and that you check the box to “Display functional attributes in data window”. Click the “OK” button when you’re done. 10. You will now see the attributes, including calculated area, for each building you’ve mapped.
11. Click on the gray title bar that says “function” to select the entire column of the Data Window (the bar becomes black). Next, click the Sort Ascending button to group your data by building type.
12. Add up all of the areas (acres) for each category. The example above shows the Academic category (yes, I rounded off the numbers!) 13. Enter the sums of each category into your Excel spreadsheet. 14. You’ll need to repeat steps 3-13 for Athletic Fields, Bleachers, and Parking Lots.
16. Click on the Chart Wizard button. 15. Highlight all of the cells of your table. 18. Click “Next”. 17. Select Pie for your Chart type. Click “Next”.
20. Try some of the various options for the labels – pick what looks best on the finished graph. 19. You can type in a new title here if you like. After changing your title, click on the Data Labels tab. 21. You may select either to have the chart in a new worksheet, or in the same sheet as your table. Click “Finish”.
22. Your pie chart will appear in your worksheet. Save your work and name it land_use.xls Our final step is getting our work into presentation form. The next section will help you with creating an interesting map.