Download
1 / 48
480 likes | 649 Views
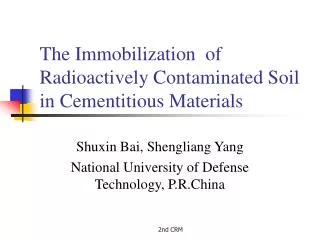
Assessment of the durability of cementitious materials in repository environment. Roberto Vicente with contributions from J ulio Takehiro Marumo Hissae Miyamoto Vera Lucia Keiko Isiki Eduardo Gurzoni Ferreira Luciano Gobbo (1)

E N D
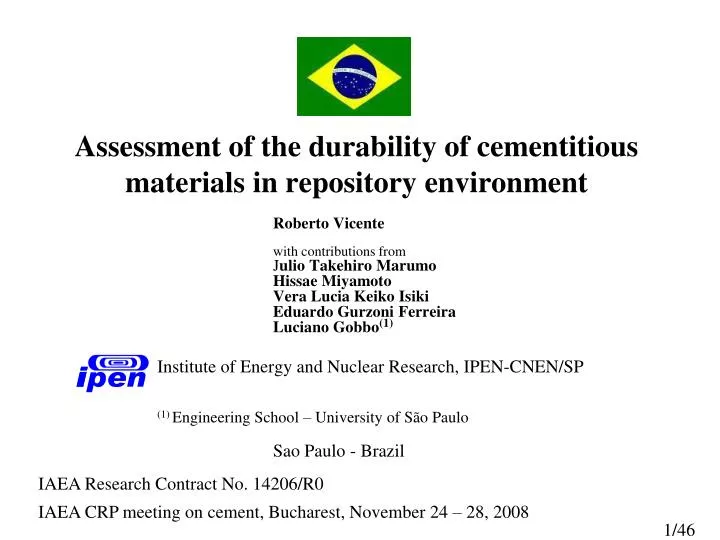
Assessment of the durability of cementitious materials in repository environment Roberto Vicente with contributions from Julio Takehiro Marumo Hissae Miyamoto Vera Lucia Keiko Isiki Eduardo Gurzoni Ferreira Luciano Gobbo(1) Institute of Energy and Nuclear Research, IPEN-CNEN/SP (1) Engineering School – University of São Paulo Sao Paulo - Brazil IAEA Research Contract No. 14206/R0 IAEA CRP meeting on cement, Bucharest, November 24 – 28, 2008
Background The concept of a deep borehole for disposal of Disused Sealed Radiation Sources (DSRS) is under development at IPEN. DSRS come from decommissioning of radioactive lightning rods, oil well logging probes, nucleonic industrial gauges, irradiators, teletherapy and brachytherapy equipment, etc. Brazilian inventory of SRS is about 270,000 sources Main radionuclides are 60Co, 90Sr, 137Cs, 226Ra, 241Am Total activity of sources is estimated at 26 PBq Most sealed sources in the Brazilian inventory would be unacceptable for disposal in near surface repositories.
General view of the concept of the borehole repository Cement paste is used to backfill the space between the steel pipe and the geological formation
Introduction In the long term, hydrated Portland cement paste (Pcp) is unstable recrystallization and chemical reactions with other materials change paste chemistry, microstructure, and mineralogy Required service life in repository → thousands of years, much longer than conventional, civil engineering experience. More data needed to predict long term performance of Pcp products as an engineered barrier in deep repositories Objectives of the present research project: to evaluate the durability of Pcp under the conditions that are expected to prevail in a deep borehole for DSRS.
Research Methodology • Method • Evaluate service life of Pcp, by extrapolating empirical results from accelerated laboratory tests • Identify degrading factors (temperature, corrosive media, radiation, etc.) present in repository environment • Estimate extreme levels of the factors, deemed to prevail in actual repository conditions • Design multifactorial exposure experiments to assess the effects of single factors and their interactions • Run accelerated tests; measure changes in properties; model the long term performance; estimate durability.
Assumptions • Degrading processes can be accelerated by test conditions • Measured properties can be associated with material performance under repository conditions • Performance can be modeled based on test results • Short term results can be extrapolated to long term
Factors under consideration in the multifactorial experiments • 1. Pcp composition: • a) cement types; b) water/cement ratios; c) cement admixtures. • 2. Repository exposure environment: • a) ionising radiation; b) high temperature; c) groundwater ions Product properties changes Observed effects: a) loss of mechanical strength; b) swelling/shrinkage; c) variation in hydraulic permeability/porosity; d) changes in mineralogy.
Sample description Brazilian ABNT standard Portland cement type II (OPC: ordinary Portland cement) and type V (HES: high early strength cement. Water to cement ratio: 0.35; no additives. Geometry and size: cylindrical samples, [ =2.5cm h=5cm] selected to allow irradiation with even dose distribution, while maintaining size as large as possible. Standard size [=5cm h=10cm] cylindrical specimens, with same composition, used as reference for checking suitability of procedures and testing equipment with small samples.
5 cm Sample description 2.5 cm Left: acrylic, reusable, small moulds (2.5 x 5) and two Pcp samples in the foreground. Right: polystyrene, disposable, standard size moulds (5x10) with Pcp samples being cast.
Radiation: Irradiation produces radiolysis and radiolytic gases that affect Pcp chemistry. Planned: 8 MGy≡dose delivered by the most active and long lived sources of the inventory (corresponding to complete decay of 56 TBq - 137Cs or 2 GBq - 226Ra sources Realized: 400 kGy (dose rate 4 kGy/h) in a multipurpose compact irradiator with 3.4 TBq of 60Co. (because of availability of irradiation facility and dosimetry) Higher doses and different dose rates will be tested later.
Corrosion: reactions with dissolved ions in granitoid rock pore water degrade Pcp. Reported low-, high-, and average-concentrations (g.L1): low high average Ca2+ 0.0011 1.89 0.27 Na+ 0.001 2.1 0.37 K+ 0.000156 0.0251 0.01 Mg2+ 1.92x10⁻⁵ 0.0734 0.01 Cl– 0.002 6.34 0.99 F– 0.0001 0.00627 0.0013 HCO3– 0.01 0.309 0.10 SO42– 0.0009 0.56 0.11 Si 0.00297 0.039 0.01 Fe 0.000056 0.0016 0.0005 NO3–0.0008 0.0015 0.0011 concentrations used in the test
Temperature: long term exposure to the temperature prevailing at the depth of the repository can negatively affect Pcp • induces loss of pore water (?) • accelerates groundwater chemical reactions • influences (positively or negatively) reactions with radiolytic gases • T = 60 oC, initial test condition, considering • geothermal gradient 0.075 oC.m–1, in top 400 m of the earth crust, • mean local earth surface temperature of 30 oC. • These figures are quite arbitrary but reasonable as a first approach, taking into account that the geothermal gradient varies between 10 and 200 oC.km–1, with an average, or normal, value 25 oC.km–1.
Results 1. Mechanical strength - preliminary ABNT Standards accept a coefficient of variation (CV) of less than 6% (for n = 4 specimens) for cement mortars. Expected values for Pcp was about 10%. Preliminary trials, instead, showed a CV as high as 50%. This could hamper the effects of stress factors being observed on Pcp samples, because the large pre-exposure variation could mask any post-exposure changes in material properties.
cement type sample size
The density of the paste, on the other hand, is uniform in all samples, the observed variation being the result more of error in the geometric volume measurements than in the actual quantity. All results fall inside an envelope around the mean of
Investigation of possible causes of the observed variability: • mistakes in sample preparation (for instance, too many or too large entrained air bubbles) • poor cement quality or aged packages (partially hydrated) • inadequate plastic moulds (low deviation toward a conical shape) • bad storage conditions during setting and hardening of samples (hardening in sealed moulds vs hardening in saturated moist air) • defective test machine or test setup (off center sample holder)
Actions taken • Recalibration of test machine and check of test conditions • Agreement with the Institute of Technology Research (ipt), a recognized Brazilian laboratory of cement: a series of samples was cast and tested, aiming at finding the causes of the observed large variation in the strength of the Pcp samples.
Discussion of preliminary results Results of mechanical strength of Pcp, as measured by axial compression of cylindrical samples, showed a much larger variation than the expected CV of around 10%, even those cast and tested by the reference laboratory personnel. Careful choice of experimental conditions could not avoid that variation and its reason is as yet unexplained. It seems as if the variability in mechanical strength of Pcp were intrinsically large, a result that was not found in the examined literature. However, we continue to pursue an explanation to this finding as well a means of avoiding this large uncertainty in further experiments.
It follows the initially established experimental plan of exposing samples to the deteriorating factors. 144 samples, randomly distributed among 24 sets
Results of the multifactorial experiment – strength distilled water
Results of the multifactorial experiment – Shrinkage/swelling Distilled water 0 = after setting 1 = after immersion 3 = before irradiation 4 = after irradiation
Results of the multifactorial experiment – Shrinkage/swelling 0 = after setting 1 = after immersion 3 = before irradiation 4 = after irradiation
Results of the multifactorial experiment – Shrinkage/swelling 0 = after setting 1 = after immersion 3 = before irradiation 4 = after irradiation
Results of the multifactorial experiment – Shrinkage/swelling 0 = after setting 1 = after immersion 3 = before irradiation 4 = after irradiation
Results of the multifactorial experiment – water absorption on immersion (1, 2, 3) loss after immersion and irradiation (4) 1 2 3 4
Results of the multifactorial experiment – water loss after dry storage and irradiation
Results of the multifactorial experiment – X-Ray Diffraction 50 samples analyzed – results of 10 samples presented here
Results of the multifactorial experiment Diffractogram of the 10 samples Ettringite peak – not observed in samples 49 and 50
Results of the multifactorial experiment Diffractogram of sample ‘5’ with main peaks described
Diffractograms of 10 different samples Results of the multifactorial experimentCluster Analysis - the 10 samples were grouped in 4 clusters by similarity
Results of the multifactorial experiment Dendrogram of the XRD results
needles Results of the multifactorial experiment: scanning electron micrographs - sample 1 surface, after immersion in salt solution; needlelike crystals are probably ettringite because of form and sulfur presence. 1 grains
needles Results of the multifactorial experiment: scanning electron micrography- sample 2 surface, after immersion in salt solution; Ettringite evidence is consistent with SO42- ions presence in immersion solution 2 grains
grain 1 Results of the multifactorial experiment: scanning electron micrography- sample 3 surface, after immersion in salt solution; grain 2
Results of the multifactorial experiment Immersion bath composition analyses DW = distilled water; SS = salt solution
Results of the multifactorial experiment: Immersion bath composition analyses Concentration of species in g.L1 [Ca, Na, K, Mg, Si, Fe, Al] by ICP-OES [Cl, F, SO4, NO3] by ion chromatography K Fe Cl Na SO42 Ca K NO3 F Na Ca Si Mg SO42 Mg NO3 Al Si Cl Ratio final/initial concentrations F Fe
CONCLUSIONS The Pcp samples were exposed to environmental conditions expected to induce changes in composition and structure which degrade the macroscopic properties of tested specimens. The level of exposure were set as to reproduce the worst conditions expected to prevail in the environment of a repository for disused sealed radiation sources disposed of in a deep bore-hole. In most cases the analytical techniques employed were not able to detect changes in sample properties because the variance of pre-exposure results was large enough to overshadow the effects of those changes in measured sample properties. Up to now, we could neither understand the large variability in fresh sample properties nor be able to avoid it. However, about the question on whether to proceed with the research work, results thus far seem to give support to the chosen methodology.
Annex: Cluster Analysis of XR Diffractograms Cluster analysis simplifies the analysis of data, automatically sorting closely related scans into separate clusters and marking the most representative scan of each cluster as well as outlying patterns. It is a three step process: 1. Compare all scans with each other and build a correlation matrix representing the similarity of any given pair of scans. 2. Put the scans in different classes defined by similarity, the branches of a dendrogram, by agglomerative hierarchical cluster analysis. 3. Estimate the number of clusters by the KGS test or by the largest relative step on the dissimilarity scale, and determine the most representative scan within each cluster.
Cluster Analysis of XR Diffractograms The KGS test describes a penalty function which can be plotted against the number of clusters. The minimum of this penalty function indicates the optimum cut-off value and thus the “right” number of clusters according to this method. The minimum represents a state where the clusters are as highly populated as possible, whilst simultaneously maintaining the smallest spread. The advantage of both methods with respect to other methods is that they always show a “best” cut-off value as a result. KGS test stands for: Kelley, L.A., Gardner, S.P.,Sutcliffe, M.J. (1996) An automated approach for clustering an ensemble of NMR-derived protein structures into conformationally-related subfamilies, Protein Engineering, 9, 1063-1065.