Download

1 / 14
140 likes | 249 Views
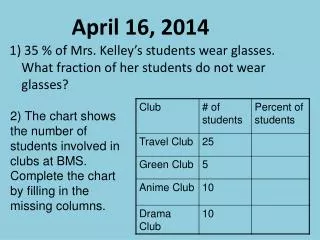
WELCOME Educational Results Overview State Attendance Conference April 16, 2014. Tennessee’s education system is a priority. Only 21% of adults in TN have a college degree. Tennessee’s Competitiveness. 54% of new jobs will require post-secondary education.

E N D
WELCOME Educational Results Overview State Attendance Conference April 16, 2014
Tennessee’s education system is a priority Only 21% of adults in TN have a college degree Tennessee’s Competitiveness 54% of new jobs will require post-secondary education TN ranks 46thin 4th grade math and 41st in 4th grade reading nationally Only 15% of high school seniors in TN are college ready Source: “Projections of Jobs and Education Requirements Through 2018” (The Georgetown University Center on Education and the Workforce), 2011 NCES NAEP data, ACT
We need to prepare students to achieve their aspirations TN students aspire to a postsecondary degree …but only 15% are college-ready in all 4 subjects Over 60% of TN’s 1st time college freshmen require remedial or developmental courses at the college level Source: 2011 ACT
TDOE strategic plan to support districts in meeting their ambitious goals
Tennessee aims to be the fastest improving state in the nation by 2015 Tennessee Measured by progress on NAEP, ACT, and PARCC
Progress made on TCAP since moving to new assessments in 2010 Percent Proficient and Advanced Grades 3-8 Grades 9-12
These gains mean thousands of additional students are performing on grade level • Nearly 91,000 additional students are at or above grade level in all math subjects now, as compared to 2010. • Nearly 52,000 additional students are at or above grade level in all science subjects, as compared to 2010. 2010 2013 2010 2011 2013 *2011 was the baseline year for the Algebra II EOC.
Tennessee’s gains on TCAP are substantial when compared with other states Top states in percentage point gains, 2010-11 to 2011-12 * In 2011-12, Delaware began providing students with a second opportunity to retake its state assessment, and included in its accountability data only the higher score for any student who took the test twice. http://www.doe.k12.de.us/dcas/files/StateSumOverviewReport2012.pdf; http://news.delaware.gov/2012/06/13/state-tests-show-student-gains/
EXPLORE and PLAN results show Tennessee making substantial growth over the last three years EXPLORE (8th grade) PLAN (10th grade) Tennessee Results National Norm
Tennessee educators were more positive overall than any other state that administered TELL 11