Download
1 / 1
10 likes | 138 Views
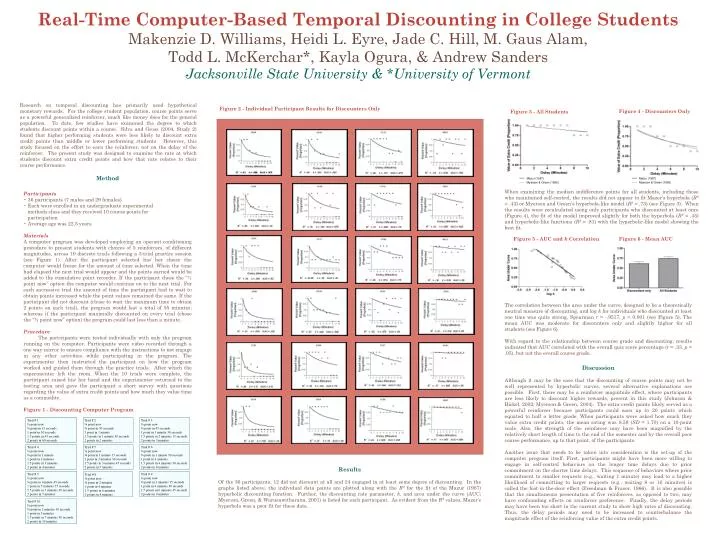
Figure 4 - Discounters Only. Figure 3 - All Students. — Mazur (1987) ----- Myerson & Green (1995). — Mazur (1987) ----- Myerson & Green (1995). Figure 6 - Mean AUC. Figure 5 - AUC and k Correlation.

E N D
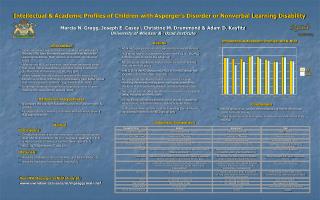
Figure 4 - Discounters Only Figure 3 - All Students — Mazur (1987) ----- Myerson & Green (1995) — Mazur (1987) ----- Myerson & Green (1995) Figure 6 - Mean AUC Figure 5 - AUC and k Correlation Real-Time Computer-Based Temporal Discounting in College StudentsMakenzie D. Williams, Heidi L. Eyre, Jade C. Hill, M. Gaus Alam, Todd L. McKerchar*, Kayla Ogura, & Andrew SandersJacksonville State University & *University of Vermont Research on temporal discounting has primarily used hypothetical monetary rewards. For the college student population, course points serve as a powerful generalized reinforcer, much like money does for the general population. To date, few studies have examined the degree to which students discount points within a course. Silva and Gross (2004, Study 2) found that higher performing students were less likely to discount extra credit points than middle or lower performing students. However, this study focused on the effort to earn the reinforcer, not on the delay of the reinforcer. The present study was designed to examine the rate at which students discount extra credit points and how that rate relates to their course performance. Figure2 - Individual Participant Results for Discounters Only • Method • Participants • 36 participants (7 males and 29 females) • Each were enrolled in an undergraduate experimental • methods class and they received 10 course points for • participation • Average age was 22.5 years • Materials • A computer program was developed employing an operant conditioning procedure to present students with choices of 5 reinforcers, of different magnitudes, across 10 discrete trials following a 3-trial practice session (see Figure 1). After the participant selected his/ her choice the computer would freeze for the amount of time selected. When the time had elapsed the next trial would appear and the points earned would be added to the cumulative point recorder. If the participant chose the “½ point now” option the computer would continue on to the next trial. For each successive trial the amount of time the participant had to wait to obtain points increased while the point values remained the same. If the participant did not discount (chose to wait the maximum time to obtain 2 points on each trial), the program would last a total of 55 minutes; whereas if the participant maximally discounted on every trial (chose the “½ point now” option) the program could last less than a minute. • Procedure • The participants were tested individually with only the program running on the computer. Participants were video recorded through a one way mirror to ensure compliance with the instructions to not engage in any other activities while participating in the program. The experimenter then instructed the participant on how the program worked and guided them through the practice trials. After which the experimenter left the room. When the 10 trials were complete, the participant raised his/ her hand and the experimenter returned to the testing area and gave the participant a short survey with questions regarding the value of extra credit points and how much they value time as a commodity. • Figure 1 - Discounting Computer Program When examining the median indifference points for all students, including those who maintained self-control, the results did not appear to fit Mazer’s hyperbola (R2 = .43) or Myerson and Green’s hyperbola-like model (R2 = .73) (see Figure 3). When the results were recalculated using only participants who discounted at least once (Figure 4), the fit of the model improved slightly for both the hyperbola (R2 = .45) and hyperbolic-like functions (R2 = .81) with the hyperbolic-like model showing the best fit. The correlation between the area under the curve, designed to be a theoretically neutral measure of discounting, and log k for individuals who discounted at least one time was quite strong, Spearman r = -.9517, p < 0.001 (see Figure 5). The mean AUC was moderate for discounters only and slightly higher for all students (see Figure 6). With regard to the relationship between course grade and discounting, results indicated that AUC correlated with the overall quiz score percentage (r = .33, p < .05), but not the overall course grade. Discussion Although it may be the case that the discounting of course points may not be well represented by hyperbolic curves, several alternative explanations are possible. First, there may be a reinforcer magnitude effect, where participants are less likely to discount higher rewards, present in this study (Johnson & Bickel, 2002; Myerson & Green, 2004). The extra credit points likely served as a powerful reinforcer because participants could earn up to 20 points which equated to half a letter grade. When participants were asked how much they value extra credit points, the mean rating was 8.58 (SD = 1.70) on a 10-point scale. Also, the strength of the reinforcer may have been magnified by the relatively short length of time to the end of the semester and by the overall poor course performance, up to that point, of the participants. Another issue that needs to be taken into consideration is the set-up of the computer program itself. First, participants might have been more willing to engage in self-control behaviors on the longer time delays due to prior commitment on the shorter time delays. This sequence of behaviors where prior commitment to smaller requests (e.g., waiting 1 minute) may lead to a higher likelihood of committing to larger requests (e.g., waiting 8 or 10 minutes) is called the foot-in-the-door effect (Freedman & Fraser, 1966). It is also possible that the simultaneous presentation of five reinforcers, as opposed to two, may have confounding effects on reinforcer preference. Finally, the delay periods may have been too short in the current study to show high rates of discounting. Thus, the delay periods may need to be increased to counterbalance the magnitude effect of the reinforcing value of the extra credit points. Trial # 1 ½ point now ¾ point in 15 seconds 1 point in 30 seconds 1.5 points in 45 seconds 2 points in 60 seconds Trial # 2 ½ point now ¾ point in 30 seconds 1 point in 1 minute 1.5 points in 1 minute 30 seconds 2 points in 2 minutes Trial # 3 ½ point now ¾ point in 45 seconds 1 point in 1 minute 30 seconds 1.5 points in 2 minutes 15 seconds 2 points in 3 minutes Trial # 4 ½ point now ¾ point in 1 minute 1 point in 2 minutes 1.5 points in 3 minutes 2 points in 4 minutes Trial # 5 ½ point now ¾ point in 1 minute 15 seconds 1 point in 2 minutes 30 seconds 1.5 points in 3 minutes 45 seconds 2 points in 5 minutes Trial # 6 ½ point now ¾ point in 1 minute 30 seconds 1 point in 3 minutes 1.5 points in 4 minutes 30 seconds 2 points in 6 minutes Results Of the 36 participants, 12 did not discount at all and 24 engaged in at least some degree of discounting. In the graphs listed above, the individual data points are plotted along with the R2 for the fit of the Mazur (1987) hyperbolic discounting function. Further, the discounting rate parameter, k, and area under the curve (AUC; Myerson, Green, & Warusawitharana, 2001) is listed for each participant. As evident from the R2 values, Mazer’s hyperbola was a poor fit for these data. Trial # 7 ½ point now ¾ point in 1minute 45 seconds 1 point in 5 minutes 15 seconds 1.5 points in 3 minutes 30 seconds 2 points in 7 minutes Trial # 9 ½ point now ¾ point in 2 minutes 15 seconds 1 point in 4 minutes 30 seconds 1.5 points in 6 minutes 45 seconds 2 points in 9 minutes Trial # 8 ½ point now ¾ point in 2 minutes 1 point in 4 minutes 1.5 points in 6 minutes 2 points in 8 minutes Trial # 10 ½ point now ¾ point in 2 minutes 30 seconds 1 point in 5 minutes 1.5 points in 7 minutes 30 seconds 2 points in 10 minutes