Download
1 / 29
290 likes | 455 Views
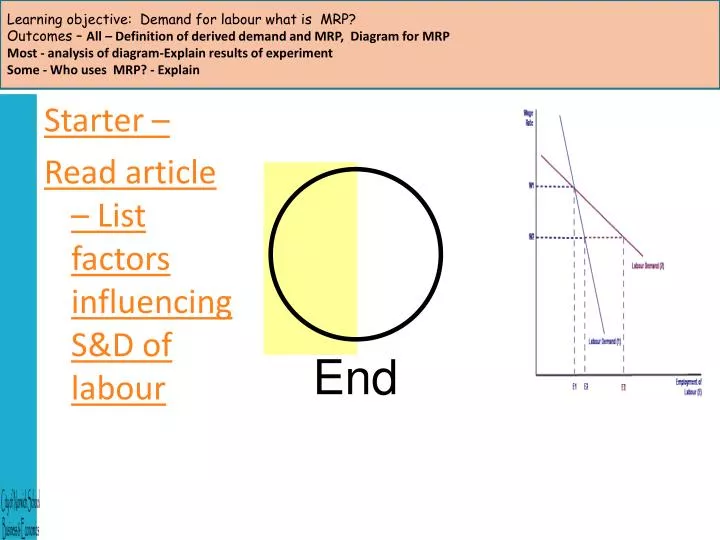
Starter – Read article – List factors influencing S&D of labour. End. Objective – To know - What are the determinants of elasticity of demand for labour Learning objective: What is derived demand and MRP?

E N D
Starter – Read article – List factors influencing S&D of labour End
Objective – To know - What are the determinants of elasticity of demand for labour • Learning objective: What is derived demand and MRP? • Outcomes – All– Definition of derived demand and MRP, Diagram for MRP analysis of diagram-Explain • Some - Who uses MRP - Explain
Past paper Q - June 20024. (a) Explain the factors which determine the marginal’s revenue product of labour [10] (b) Discuss the extent to which marginal revenue product is the crucial factor in explaining why top soccer players earn so much more than waiters and waitresses [15] • REMEMBER Q’S ARE NOW Q 15 AND 20 MARKS!
Derived Demand The demand for labour is a derived demand. Firms only demand employees because of the demand for actual products. We only want you for your output Increase in output Increase in demand for labour
Marginal Revenue Product • People are employed because of the value of their output. This depends on: • The extra output that each extra worker produces (Marginal Product /marginal physical product) MP • The extra revenue this extra worker generates when it is sold (Marginal Revenue) MR • the value of the output produced by an extra worker is called the Marginal Revenue Product (MRP) MRP=MPxMR
Marginal Revenue Productivity • Assumptions: Labour is the only variable factor of production • Labour is homogeneous- labour cannot dictate price • The labour market is perfectly competitive so no one employer can influence the wage rate • The firm operates in a perfectly competitive product market • DOES THIS EXIST IN REALITY?
The Demand for Labour – Why slope? • The demand for labour is downward sloping due to the law of diminishing returns, which states: • As successive units of a homogeneous variable factor of production are added to a fixed factor, the increments to total output will rise first and then eventually diminish, ceteris paribus.
Get into two/three teams – You will be in charge of making burgers- • Nominate 1 person to cut shapes- no one can help them – the rest of you keep count of productivity • To make a burger you have to cut out from the template and then transport and stick up for sale using your blue tack onto the flip chart paper, starting at month 1. • You start when told and finish when told (2 mins)-only finished burgers counted
Firm sells • products for £2 • Wage rate is • constant at £10 • Fill in Gaps • How many workers should they employ?
2 Minute Timer Nominate 1 person to cut shapes- no one can help them – the rest of you keep count of productivity To make a burger you have to cut out from the template and then transport and stick up for sale using your blue tack onto the flip chart paper, starting at month 1. You start when told and finish when told (2 mins)-only finished burgers counted End
2 Minute Timer How did you get on? What fresources/factors are represented in the game so far?) Total up your sheet then- Nominate another person – 1 to cut and one to stick shapes no one can help them – the rest of you keep count of productivity You start when told and finish when told (2 mins)-only finished burgers counted End
2 Minute Timer How did you get on? Did you do better? What economic key terms were we proving Total up your sheet then- Nominate another person (3 now) – 1 to cut and one to stick shapes no one can help them – the rest of you keep count of productivity You start when told and finish when told (2 mins)-only finished burgers counted End
2 Minute Timer How did you get on? Did you do better? Total up your sheet then- Nominate another person (4 now) – 1 to cut and one to stick shapes no one can help them – the rest of you keep count of productivity You start when told and finish when told (2 mins)-only finished burgers counted End
MRP on Diagram Task How much labour to employ? Draw your data into a graph showing your results Then COMMENT on the diagram using economic terms. Wage Rate W MCL MRP Quantity of Labour Q1 Q2 Q3 Q4
Equilibrium Level of employment • Profit maximising level of employment occurs where MCf = MRP MCL = Supply of Labour MRP = MPP x P = Demand for Labour
Problems with MRP (Marginal Revenue Productivity Theory • How do we measure the productivity of workers in the service sector, eg teacher, supermarket cashier, nurse, secretary? • Is there a price that can be put on all workers’ output? • MRP theory requires us to assume we can measure the output of each worker. • In reality job evaluation is required to set performance targets
But in reality…. MRP is difficult to measure as difficult to isolate: • Individuals contribution when working in a team • Contribution made by labour & Capital • Difficult to measure the Marginal Product of some workers in the tertiary sector e.g. surgeons 5 hip replacements vrs 1 heart/lung transplant
Problems with Marginal Revenue Productivity Theory • Knowledge of the MRP curve will let us work out how many workers will be employed but doesn’t tell us how the wage rate is determined. • Wage levels depend upon the interaction of demand and supply of labour • ONLY WORKS IN PERFECT COMP – I.E. A MODEL!
Demand Curve for Labour • What might cause the demand for labour to shift from DL1 to DL2? • Increase in Productivity • Increase in demand for the product • Increase in the price of the product • Increase in the price of capital DL2 DL1
Task 1 - complete exercise 7.1 on Labour market equilibrium – (2 minutes) • (Draw diagram showing analysis of the effects on labour market equilibrium if there is a fall in selling price of a firms product • Then - “What does it depend on?”
Plenary • Who uses MRP? • What are the factors discussed today? • What is most important and WHY?