Download
1 / 11
110 likes | 214 Views
Data Collection and Analysis Area Measurement. How to measure the perimeter and area of an arbitrary closed shape?. Data Collection and Analysis Area Measurement. How to measure the perimeter and area of an arbitrary closed shape? Consider Descartes’ method:.

E N D
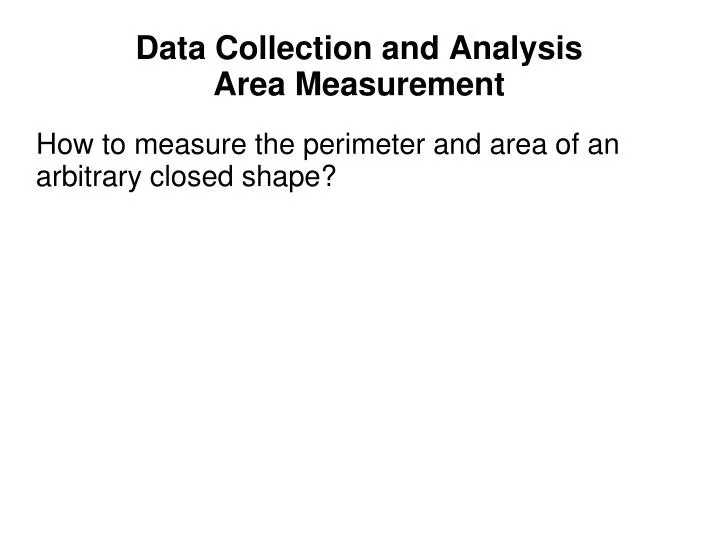
Data Collection and AnalysisArea Measurement • How to measure the perimeter and area of an arbitrary closed shape?
Data Collection and AnalysisArea Measurement • How to measure the perimeter and area of an arbitrary closed shape? • Consider Descartes’ method: Could we do this by driving a robot around the shape? From Historical Connections in Mathematics, Volume III, Area the Easy Way
Data Collection and AnalysisArea Measurement North • Need to generate (x, y) pairs as the robot follows the line around… • But unlike the plotted curve, the robot does not know what the next pair will be. • Need to find a way to remember the last point and calculate the next one. • Just a little trigonometry… • and a compass. X new = X old + ΔX Y new = Y old + ΔY (X new, Y new) Heading ΔY ΔX = Dist *Sine (Hdg) Distance ΔY = Dist *Cosine (Hdg) (X old, Y old) ΔX Inspired by Area the Easy Way
Data Collection and AnalysisArea Measurement X new = X old + ΔX Y new = Y old + ΔY North • Need to generate (x, y) pairs as the robot follows the line around… • But unlike the plotted curve, the robot does not know what the next pair will be. • Need to find a way to remember the last point and calculate the next one. • Just a little trigonometry… • and a compass. (X new, Y new) Heading ΔY ΔX = Dist *Sine (Hdg) Distance ΔY = Dist *Cosine (Hdg) (X old, Y old) ΔX Sine and cosine provide positive and negative factors that scale the sides of the right triangle. Inspired by Area the Easy Way
Data Collection and AnalysisArea Measurement • Show development of the path as the robot follows along the orange curve. X new = X old + ΔX Y new = Y old + ΔY ΔX = Dist *Sine (Hdg) ΔY = Dist *Cosine (Hdg) Sine and cosine provide positive and negative factors that scale the sides of the right triangle. Inspired by Area the Easy Way
Data Collection and AnalysisArea Measurement • Show development of the path as the robot follows along the orange curve. X new = X old + ΔX Y new = Y old + ΔY ΔX = Dist *Sine (Hdg) ΔY = Dist *Cosine (Hdg) ΔY ΔX Sine and cosine provide positive and negative factors that scale the sides of the right triangle. Inspired by Area the Easy Way
Data Collection and AnalysisArea Measurement • Example path showing generated (x, y) pairs as the robot follows the line around. X new = X old + ΔX Y new = Y old + ΔY North ΔX = Dist *Sine (Hdg) ΔY = Dist *Cosine (Hdg) (X2, Y2) (X1, Y1) ΔY (X0, Y0) ΔX Sine and cosine provide positive and negative factors that scale the sides of the right triangle. Inspired by Area the Easy Way
Data Collection and AnalysisArea Measurement • Example path showing generated (x, y) pairs as the robot follows the line around. X new = X old + ΔX Y new = Y old + ΔY North ΔX = Dist *Sine (Hdg) ΔY = Dist *Cosine (Hdg) (X2, Y2) (X5, Y5) (X1, Y1) ΔY (X3, Y3) (X4, Y4) (X0, Y0) ΔX Sine and cosine provide positive and negative factors that scale the sides of the right triangle. Inspired by Area the Easy Way
Data Collection and AnalysisArea Measurement – two plots X new = X old + ΔX Y new = Y old + ΔY • Circle with Distance = 1 inch Rectangle with Distance = 1 inch North (X new, Y new) Heading ΔY ΔX = Dist *Sine (Hdg) ΔY = Dist *Cosine (Hdg) Distance (X old, Y old) ΔX Inspired by Area the Easy Way
Data Collection and AnalysisArea Measurement – two plots • Circle with Distance = 1 inch Rectangle with Distance = 1 inch Red arrows indicate error accumulated through each run. Inspired by Area the Easy Way