Download
1 / 26
260 likes | 417 Views
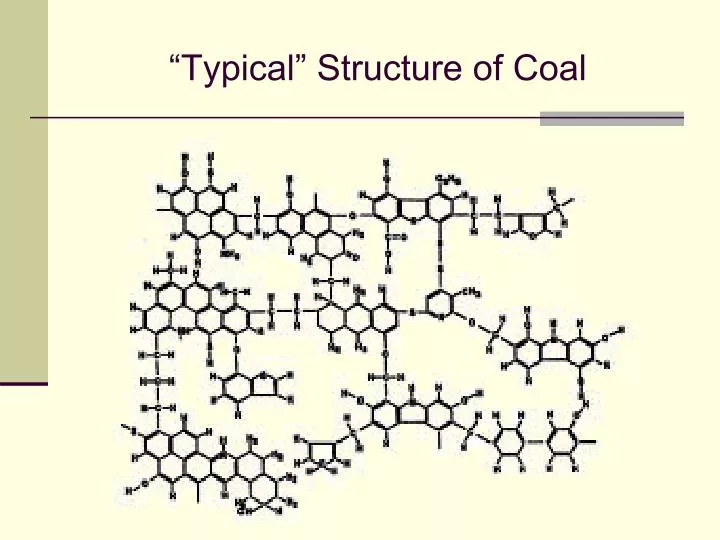
“Typical” Structure of Coal. Global Coal Reserves. Breakdown of Energy Sources. Proven Reserves of Petroleum. Proven Reserves of Petroleum. US Oil Production—obviously pre BP. What’s IN a barrel of Oil. Always compare apples to apples?. Structure of a Methane Clathrate. Marcellus Shale.

E N D
Marcellus Shale Devonian ‘black shale’ Known now as the Marcellus Shale Lines show the depth of the shale layer In NEPA, that layer is pretty thick—around 200 feet!
Where is this shale? Numbers show the depth where shale is found In NEPA, that’s 1-2 miles deep. So…going a mile deep for 200 feet of shale Sensible economics
Shale—this is all about natural gas This 0.2-mm cross section of shale Natural gas occurs in three ways: pore spaces of shale within vertical fractures (joints) that break through the shale adsorbed on mineral grains and organic material. Most NG contained within the pores, but remains trapped
The ‘fractures’ I referred to This is a vertical view of the shale, fracture is pretty easy to see. Gas can ‘escape’ along these fractures.
Disparate Estimates • Initial ‘estimates’ of how much natural gas suggested ~ 1.9 trillion cubic feet of natural gas. (Est. in 2002) • Energy conversion 6000 cubic feet = I barrel of oil • 500 million barrels of oil (energy equivalent) approximate • Where is it? Question not so clear…distribution of NG not homogenous (consistent). • Odds improve if you find a thick layer though…AND if that layer is closer to the surface. • NEPA sort of fits that bill. • NG wells in Marcellus began in 2000 though (and continue)
Preliminary wells • Such a large area—the ‘return’ per acre unlikely to produce enough revenue quickly enough. • Some very long-term investors did do this, and turned a profit. • Sustained production over time, though some decrease. • 2003—Range Resources drills a well in Washington County (PA) and found a promising supply of NG • Experimented with the horizontal drilling and hydraulic fracturing techniques • From 2005—2007, 375 wells drilled in PA
Horizontal drilling—what it ‘looks like’ Cartoon depicts the process, vertical for a mile—then horizontal Note the horizontal goes perpendicular to the fractures
And then…the explosion (of sorts) • The techniques helped, but still, the cost and the small ‘proved reserves’ limited production. • 2008—Penn St. Geosciences Prof (Terry Englander) suggested that Marcellus could contain much more!! • Conservative estimate—168 trillion cubic feet • Upper estimate—516 trillion cubic feet • Recovery rate ~ 10 % (17-52 tcf) • (3-10 billion barrels of oil equivalent)
Hurry up and slow down • With that ‘estimate’—people went berserk. The estimates doubled (on the upper end) the ‘proved reserves’ of US NG. • 245 trillion cubic feet (2009) • 238 tcf (2008)…that’s not a typo. • World (2009)—6,212 tcf • US consumption (per day and per year?) • 20.6 million barrels (2007) • 18.7 million barrels (2009)—yes, a decrease • 7.5 billion barrels per year (2007) • 6.82 billion barrels per year (2009)
Pros and the cons of this? • Obviously, the most significant impact is economic. • Two avenues—leases or royalties. • Leases (per acre)…guaranteed income, regardless of production • 2005—not much interest. • 2006—potential begins to emerge, leasing becomes option • 2007—more production, $100 to several hundred per acre • 2008—leases of up to $2000 per acre! Not bad eh?
Enter Royalties • Leasing offers guaranteed income, but royalties have higher upside. Not a ‘land rental’ but wellhead. • Royalty—a share of the income that comes from the well. Common rate is ~12.5 %!! Think about that!! • Desirable property yields 1 million cubic feet/day. • Wellhead prices--$ 4.36 / 1000 cft • Well produces $ 4,360 of income per day ($ 1.6 million / yr) • Landowner? $600 per day or $ 200,000 / yr • Some wells yield millionS, yes plural—cubic feet / day
Downside? • Must also build the infrastructure associated with transportation of the NG • Pipelines, gathering systems etc. not in place • Marcellus development just in its infancy • Long-term data on wellhead production unknown. • Wells start strong, but do decline over time. • Ways to increase production at the wellhead? Fracking
Fracking and Fracking Fluid Still protected as a trade secret Basic composition pretty simple 99.9 % water (though millions of gallons) Sand, trace amounts of some chemicals (fairly harmless), Lubricants (oils), surfactants (soaps) and chlorinated (bacteria)
So why all the fuss about Fracking • It’s not the fracking fluid…it’s what happens