Download
1 / 1
10 likes | 178 Views
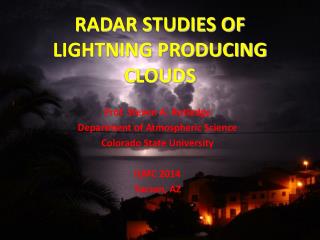
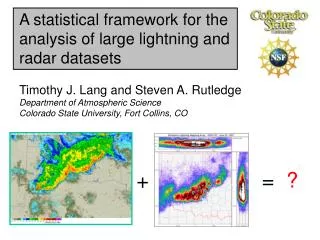
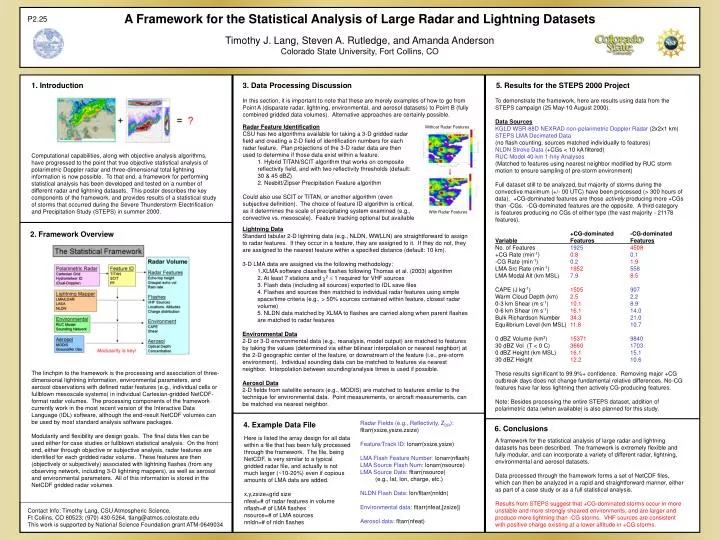
A Framework for the Statistical Analysis of Large Radar and Lightning Datasets Timothy J. Lang, Steven A. Rutledge, and Amanda Anderson Colorado State University, Fort Collins, CO. P2.25. 1. Introduction. 3. Data Processing Discussion. 5. Results for the STEPS 2000 Project.

E N D
A Framework for the Statistical Analysis of Large Radar and Lightning Datasets Timothy J. Lang, Steven A. Rutledge, and Amanda Anderson Colorado State University, Fort Collins, CO P2.25 1. Introduction 3. Data Processing Discussion 5. Results for the STEPS 2000 Project In this section, it is important to note that these are merely examples of how to go from Point A (disparate radar, lightning, environmental, and aerosol datasets) to Point B (fully combined gridded data volumes). Alternative approaches are certainly possible. To demonstrate the framework, here are results using data from the STEPS campaign (25 May-10 August 2000). Data Sources KGLD WSR-88D NEXRAD non-polarimetric Doppler Radar (2x2x1 km) STEPS LMA Decimated Data (no flash counting, sources matched individually to features) NLDN Stroke Data (+CGs < 10 kA filtered) RUC Model 40-km 1-hrly Analyses (Matched to features using nearest neighbor modified by RUC storm motion to ensure sampling of pre-storm environment) Full dataset still to be analyzed, but majority of storms during the convective maximum (+/- 00 UTC) have been processed (> 300 hours of data). +CG-dominated features are those actively producing more +CGs than -CGs. -CG-dominated features are the opposite. A third category is features producing no CGs of either type (the vast majority - 21178 features). +CG-dominated -CG-dominated Variable Features Features No. of Features 19254508 +CG Rate (min-1) 0.80.1 -CG Rate (min-1) 0.21.9 LMA Src Rate (min-1) 1952558 LMA Modal Alt (km MSL) 7.98.5 CAPE (J kg-1) 1505907 Warm Cloud Depth (km) 2.52.2 0-3 km Shear (m s-1) 10.18.9 0-6 km Shear (m s-1) 16.114.0 Bulk Richardson Number 34.321.0 Equilibrium Level (km MSL) 11.810.7 0 dBZ Volume (km3) 153719840 30 dBZ Vol (T < 0 C) 36601703 0 dBZ Height (km MSL) 16.115.1 30 dBZ Height 12.210.6 These results significant to 99.9%+ confidence. Removing major +CG outbreak days does not change fundamental relative differences. No-CG features have far less lightning then actively CG-producing features. Note: Besides processing the entire STEPS dataset, addition of polarimetric data (when available) is also planned for this study. Radar Feature Identification CSU has two algorithms available for taking a 3-D gridded radar field and creating a 2-D field of identification numbers for each radar feature. Plan projections of the 3-D radar data are then used to determine if those data exist within a feature. 1. Hybrid TITAN/SCIT algorithm that works on composite reflectivity field, and with two reflectivity thresholds (default: 30 & 45 dBZ) 2. Nesbitt/Zipser Precipitation Feature algorithm Could also use SCIT or TITAN, or another algorithm (even subjective definition). The choice of feature ID algorithm is critical, as it determines the scale of precipitating system examined (e.g., convective vs. mesoscale). Feature tracking optional but available Without Radar Features Computational capabilities, along with objective analysis algorithms, have progressed to the point that true objective statistical analysis of polarimetric Doppler radar and three-dimensional total lightning information is now possible. To that end, a framework for performing statistical analysis has been developed and tested on a number of different radar and lightning datasets. This poster describes the key components of the framework, and provides results of a statistical study of storms that occurred during the Severe Thunderstorm Electrification and Precipitation Study (STEPS) in summer 2000. With Radar Features Lightning Data Standard tabular 2-D lightning data (e.g., NLDN, WWLLN) are straightforward to assign to radar features. If they occur in a feature, they are assigned to it. If they do not, they are assigned to the nearest feature within a specified distance (default: 10 km). 3-D LMA data are assigned via the following methodology: 1.XLMA software classifies flashes following Thomas et al. (2003) algorithm 2. At least 7 stations and 2 1 required for VHF sources 3. Flash data (including all sources) exported to IDL save files 4. Flashes and sources then matched to individual radar features using simple space/time criteria (e.g., > 50% sources contained within feature, closest radar volume) 5. NLDN data matched by XLMA to flashes are carried along when parent flashes are matched to radar features Environmental Data 2-D or 3-D environmental data (e.g., reanalysis, model output) are matched to features by taking the values (determined via either bilinear interpolation or nearest neighbor) at the 2-D geographic center of the feature, or downstream of the feature (i.e., pre-storm environment). Individual sounding data can be matched to features via nearest neighbor. Interpolation between sounding/analysis times is used if possible. Aerosol Data 2-D fields from satellite sensors (e.g., MODIS) are matched to features similar to the technique for environmental data. Point measurements, or aircraft measurements, can be matched via nearest neighbor. 2. Framework Overview The linchpin to the framework is the processing and association of three-dimensional lightning information, environmental parameters, and aerosol observations with defined radar features (e.g., individual cells or fullblown mesoscale systems) in individual Cartesian-gridded NetCDF-format radar volumes. The processing components of the framework currently work in the most recent version of the Interactive Data Language (IDL) software, although the end-result NetCDF volumes can be used by most standard analysis software packages. Modularity and flexibility are design goals. The final data files can be used either for case studies or fullblown statistical analysis. On the front end, either through objective or subjective analysis, radar features are identified for each gridded radar volume. These features are then (objectively or subjectively) associated with lightning flashes (from any observing network, including 3-D lightning mappers), as well as aerosol and environmental parameters. All of this information is stored in the NetCDF gridded radar volumes. Radar Fields (e.g., Reflectivity, ZDR): fltarr(xsize,ysize,zsize) Feature/Track ID: lonarr(xsize,ysize) LMA Flash Feature Number: lonarr(nflash) LMA Source Flash Num: lonarr(nsource) LMA Source Data: fltarr(nsource) (e.g., lat, lon, charge, etc.) NLDN Flash Data: lon/fltarr(nnldn) Environmental data: fltarr(nfeat,[zsize]) Aerosol data: fltarr(nfeat) 4. Example Data File 6. Conclusions Here is listed the array design for all data within a file that has been fully processed through the framework. The file, being NetCDF, is very similar to a typical gridded radar file, and actually is not much larger (~10-20%) even if copious amounts of LMA data are added. x,y,zsize=grid size nfeat=# of radar features in volume nflash=# of LMA flashes nsource=# of LMA sources nnldn=# of nldn flashes A framework for the statistical analysis of large radar and lightning datasets has been described. The framework is extremely flexible and fully modular, and can incorporate a variety of different radar, lightning, environmental and aerosol datasets. Data processed through the framework forms a set of NetCDF files, which can then be analyzed in a rapid and straightforward manner, either as part of a case study or as a full statistical analysis. Results from STEPS suggest that +CG-dominated storms occur in more unstable and more strongly sheared environments, and are larger and produce more lightning than -CG storms. VHF sources are consistent with positive charge existing at a lower altitude in +CG storms. Contact Info: Timothy Lang, CSU Atmospheric Science, Ft Collins, CO 80523; (970) 430-5264, tlang@atmos.colostate.edu This work is supported by National Science Foundation grant ATM-0649034