Download
1 / 38
400 likes | 588 Views
The Scientific Method. Not just for scientists!. Adapted from http://panpipes.net/edit6200/. What is it?. The scientific method is a logical sequence of steps that people use to identify, test, and answer a problem. It is broken down into six steps: State the problem.

E N D
The Scientific Method Not just for scientists! Adapted from http://panpipes.net/edit6200/
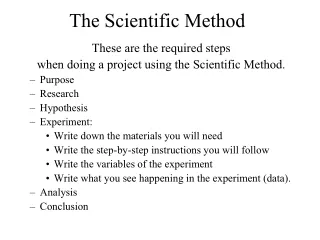
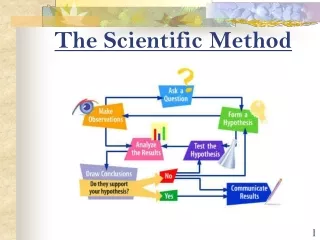
What is it? • The scientific method is a logical sequence of steps that people use to identify, test, and answer a problem. • It is broken down into six steps: • State the problem. • Form a testable hypothesis. • Design an experiment. • Collect and analyze data. • Draw conclusions. • Communicate results.
Taking a closer look… • Choosing a question or problem to solve: • Make sure it’s realistic and that you can gather the necessary resources. • When possible, choose a topic that really interests you. • Your question must include both a manipulated (independent) variable and responding (dependent) variable. • Safety first! • Make it new and interesting to YOU!
Examples of good questions… • How does the size of a wheel affect the speed of a Hotwheel’s car? • How does color affect people’s food choices? • How does age affect a person’s reaction time? • How does the amount of water affect the growth of a plant?
Checkpoint! • How are rainbows formed? • Good question. • Unsafe question. • Difficult to get materials. • No manipulated and responding variables. Correct answer is D.
How does eating food affect a person’s growth? • Good question. • Answer is already known. • Difficult to get materials. • Unsafe question. Correct answer is B.
In a crash, how does the speed of the train affect the amount of damage to a non-moving car? • Good question. • Question is not interesting. • Difficult to get materials. • No manipulated and responding variables. Correct answer is C.
How does the type of liquid affect plant growth? • Good question. • Unsafe question. • Difficult to get materials. • No manipulated and responding variables. Correct answer is A.
Taking a closer look… • Creating a testable hypothesis: • “I predict that…” • Include a statement that shows cause and effect. • It must address the manipulated and responding variables. • Right or wrong does not matter!
Examples of good hypotheses… • I predict that if a student reviews their science notes 30 minutes each day, their science test scores will improve. • I predict that the longer the mealworm the faster it will travel in a given length. • I predict that if a plant receives too much water it will become unhealthy and die.
Checkpoint! • Q - How does color affect a person’s food choices? H – I predict that if a person sees a red sweater, they will choose it over one of a different color. • “I predict that…” is missing. • There is no cause and effect statement. • Does not answer the question. • Good hypothesis. Correct answer is C.
Q - How are paper towel brand names and absorbencies related? H – If the brand name is expensive then its absorbency will be higher. • “I predict that…” is missing. • There is no cause and effect statement. • Does not answer the question. • Good hypothesis. Correct answer is A.
Q - How does age affect a person’s reaction time? H – I predict that if a person is older, they can react. • “I predict that…” is missing. • It does not include a MV and RV. • Does not answer the question. • Good hypothesis. Correct answer is B.
Q - How does the size of a wheel affect the speed of a Hotwheel car? H – I predict that a car with larger wheels will go slower than a car with smaller wheels. • “I predict that…” is missing. • There is no cause and effect statement. • Does not answer the question. • Good hypothesis. Correct answer is D.
Good morning… • Pass back graded work (2 volunteers please) • Review Vocabulary Terms and SM Cheat Sheet Steps 1 and 2 quietly • Step #3 of Scientific Method: • Design an Experiment (need Cheat sheet) • Why common measuring system? • Metrics experts
Metrics Experts • Working in rows: read your purple book pages to learn about your assigned topic • Work together to create 1 page describing the topic • Be prepared to teach your topic to the class using the document camera
Taking a closer look… • Designing an experiment: • Carefully decide what your constants will be. • Decide what materials you will need. • Decide how you will measure your constants and your manipulated variable. • List all procedures in order.
Example of designing an experiment: • Question – How does the amount of water affect plant growth? • Hypothesis – I predict that if a plant receives too much water it will become unhealthy and die. • Experiment Design: • Constants: type & age of plant, type & size of pot, amount & types of soil, amount of sunlight, type & time of water provided, time of day growth is measured. • Manipulated Variable: ? • Materials needed: 5 identical pots, soil, 5 identical bean seeds, water, graduated cylinder, sunny window. • Measuring data: Soil will be measured in grams, water will be measure in milliliters, growth will be measured in centimeters, growth will be measured from the soil to the tallest part of the plant.
Example of procedures: • Measure 300 g of soil and pour into plastic pot. Repeat for each pot. • Place 3 bean seeds on the top of the soil in each pot. • Measure 100 g more of soil and sprinkle over beans. Repeat for each pot. • Place all 5 pots in a sunny window. All pots should be positioned to receive the same amount of light. • Label each pot with a number using a sharpie. Pots will be numbered 1 - 5. • Measure 10 ml of water and pour into pot #1. Measure 20 ml of water and pour into pot #2. Put 30 ml in pot #3, 40 ml in pot #4, and 50 ml in pot #5. • Record date in log book along with water measurements for each pot. • Check plants at 4pm every day. Measure and record height (in cm) for each plant daily. Which of these procedure #’s contains the mv?
Checkpoint! • Question: How does color influence people's food choices? Hypothesis: I predict that if people see a red cookie, then they will choose it over any other color of cookie offered to them. Controlled variables: Type of cookie, color of cookies, age and gender of people being offered cookies, size and shape of cookies, temperature of cookies, "doneness" of cookies. • Correct. • One of the variables listed should not be included. • More variables need to be controlled. • These are not controlled variables. Correct answer is B.
Question: How does color influence people's food choices? Hypothesis: I predict that if people see a red cookie, then they will choose it over any other color of cookie offered to them. Materials: sugar, flour, milk, butter, food coloring (blue, red, yellow, and green), oven, cookie sheet, cookie cutter, bowls, spoons, spatula, measuring cups, serving tray, 10 girls who are 11 - 12 years old. • Correct. • Some materials listed are not necessary. • Some materials are missing. • Material list does not fit the problem or hypothesis. Correct answer is A.
Question: How does color influence people's food choices? Hypothesis: I predict that if people see a red cookie, then they will choose it over any other color of cookie offered to them. Procedures: • Mix the flour, sugar, milk, and butter according to the recipe. • Cut out the cookies using a round cookie cutter. Be sure the cookies are exactly the same size and shape. • Bake cookies according to the recipe and cool for 1 hour. • Place 5 of each color of cookie on a serving tray. • Offer guests cookies. Serve the cookies to one guest at a time, and replace the colors as they are taken. • Count how many cookies of each color are taken. • Record data. • Correct. • There are unnecessary steps included. • One of the steps is repeated. • A step has been left out. Correct answer is D.
Taking a closer look… • Collect and analyze data: • Always keep variables in mind and follow your procedures. • Organize your raw data in a table.* • Use your data table to create a graph for your conclusion. (More to come!)
Data Table Example – The effects of water on plant growth. Manipulated Responding Variable Variable Amount of Water (ml) Height of Plant (cm) 10 2 20 5 30 6 40 4 50 1
Checkpoint! • Chart • Correct. • Manipulated variable does not have a pattern of numbers. • The MV are out of order. • The MV and RV are on the wrong sides. Correct answer is D.
Chart • Correct. • Manipulated variable does not have a pattern of numbers. • The MV are out of order. • The MV and RV are on the wrong sides. Correct answer is C.
Chart • Correct. • Manipulated variable does not have a pattern of numbers. • The MV are out of order. • The MV and RV are on the wrong sides. Correct answer is A.
Chart • Correct. • Manipulated variable does not have a pattern of numbers. • The MV are out of order. • The MV and RV are on the wrong sides. Correct answer is B.
Taking a closer look… • Collect and analyze data(Graph): • MV on the x axis and the RV on the y axis. • Use a pattern of numbers for each axis.* • Include units (m, l, g) and a title. • Plot your data.
Pattern of numbers Look at the data table below. What would be a good pattern for the MV numbers? How about the RV numbers?
Checkpoint! • Graph • Correct. • MV and RV are labeled on the wrong axis. • Number pattern is incorrect. • Data not plotted correctly. Correct answer is C.
Graph • Correct. • MV and RV are labeled on the wrong axis. • Number pattern is incorrect. • There is no title included. Correct answer is D.
Graph • No units of measurement for MV & RV. • MV and RV are labeled on the wrong axis. • Number pattern is incorrect. • There is no title included. Correct answer is B.
Graph • No units of measurement for MV & RV. • MV and RV are labeled on the wrong axis. • Number pattern is incorrect. • There is no title included. Correct answer is A.
Graph • Data plotted incorrectly. • Correct. • Number pattern is incorrect. • No units of measurement for MV & RV. Correct answer is A.
Taking a closer look… • Drawing conclusions: • Restate your problem and hypothesis. • Summarize your procedures. • Explain how the MV affected the RV. (What does the graph show?) • Explain whether or not the results supported your hypothesis. • If not, why? • Future experiments.