Download

1 / 36
360 likes | 499 Views
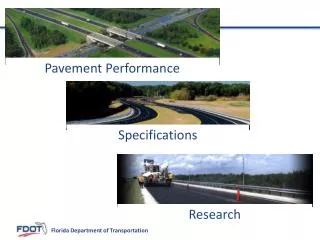
Impact of Heavy Truck Traffic on Pavement Performance. Valbon Latifi Hani H. Titi Nicholas Coley Mohammed Matar Department of Civil Engineering and Mechanics University of Wisconsin-Milwaukee Wednesday, February 26, 2014. Introduction. Height and Weight Restrictions in Wisconsin:

E N D
Impact of Heavy Truck Traffic on Pavement Performance Valbon Latifi Hani H. Titi Nicholas Coley Mohammed Matar Department of Civil Engineering and Mechanics University of Wisconsin-Milwaukee Wednesday, February 26, 2014
Introduction • Height and Weight Restrictions in Wisconsin: • Overweight (OW) = 80,000 lbs • Oversize (OS) = Height: 13’6” Width: 8’6” Length: 45’ (Single Unit) 75’ (Tractor-Trailer) • Superheavy (SHL) = 270,000 lbs • Only Single Trip permit records used for analysis.
Background • Wisconsin (WI) issued approximately 96,000 single trip permits from June 2007 to June 2013 • 432 permits were (SHLs) • Only Oversize (OS) permits excluded from analysis (height, width, and length restrictions)
Previous Studies • Acimovic (2007) conducted research on reconstructed OSOW corridor in Colorado, discovering rutting occurred less than a year later. Rutting occurred due to repeated and excessive loading of OSOW trucks. • Chatti (2004) stated that rutting damage induced on the pavement by multiple axles increased the number of axles per group increased as well.
Research Methodology • Locate corridors in WI with high use of OW and SHL trucks. • Analyze pavement performance with AASHTOWare Pavement ME Design • Build various Axle Load Spectra with baseline traffic and then the addition of OW permitted vehicles • Use Vehicle Class Distribution comparing statewide data to localized data.
Permit Fees vs. GVW #2 #3 #1 • Three random single trip permits highlighted to see discrepancy in permit fee structure and policy.
Comparison of SHL Fees • Single trip permit fees for SHL’s cost approximately $1.00 per kip. • No correlation between distance of trip and permit fee. • Should potential increase in damage imposed by SHL loads be included in permit fees with regards to distance traveled?
Case Study (Wisconsin State Highway 140) • 12 miles from IL border to I-43 and WI-11 • 21,613 permits in 6 years • 103 SHL permits in 6 years • Bypasses the I-90/I-39 tollway in Illinois • Field survey and 6 hour traffic count were conducted Courtesy of Google Maps
WI-140 Typical Section • 2” HMA Overlay • 2” HMA • 4.5” Aggregate Base Course • A-6 Soil Subgrade • 1.5” milled surface and 2” overlay in 1996
WI-140 Pavement Condition • Severe alligator cracking, rutting, longitudinal cracking, potholes, and shoulder failure. July 22, 2013
WI-140 Pavement Condition • Obliterated shoulder • Potential shoulder failure due to wide base trucks or large farm equipment. July 22, 2013
OW Vehicles • Photos taken in the field on July 22 and November 4, 2013.
Farm Equipment • Photos taken on November 4, 2013. • 10 passed through in 6 hour traffic count.
AASHTOWare • Program created to capture pavement design through the Mechanistic-Empirical Pavement Design Guide (MEPDG). • Unlike previous AASHTO Design Guides, MEPDG is a pavement analysis tool, determining the stresses and when they are projected to occur over the design life. • Three main inputs: • Traffic • Pavement Structure/Material Properties • Climate
Traffic Count on WI-140 (07/22/13) • 2.5 hour count (8:45 am to 11:15 am) • 30.1% trucks (Class 4 to 13) • 66.3% of the trucks were Class 9 • 10 marked as OS and potentially OW
Traffic Count on WI-140 (11/04/2013) • 6 hour count (8:00 am to 2:00 pm) • 33.9% trucks (Class 4 to 13) • 62.1% of the trucks were Class 9 • 15 marked as OS and potentially OW
WisDOT’s Axles per Truck • Standard values for WisDOT pavement design using AASHTOWare
VCD from WI-140 (11/04/2013) • Truck count to be used with AASHTOWare as an alternative to WisDOT standard values.
WI-140 Pavement Survey • Pavement survey data input in MicroPaver. • Pavement Condition Index (PCI) ranged from 13 to 17. • Visual distress survey (HS: high severity; MS medium severity)
Contour Map of Rutting • Majority of rutting occurring on the outer wheel path. Rutting Depth (in):
WI-140 Rutting • Southbound outer wheel path on November 4, 2013
Axle Load Spectra (Single) Baseline Traffic Baseline Traffic with OSOW Permits Included
Axle Load Spectra (Tandem) Baseline Traffic Baseline Traffic with OSOW Permits Included
Axle Load Spectra (Tridem) Baseline Traffic Baseline Traffic with OSOW Permits Included
Axle Load Spectra (Quad) Baseline Traffic Baseline Traffic with OSOW Permits Included
International Roughness Index (IRI) Threshold: 200 in/mi • Final IRI at 20 years using only WisDOT standards occurs after 18 years of service using ALS with permits integrated and 6 hour traffic count for VCD.
Rutting Threshold: 0.5 in • Final rutting at 20 years using only WisDOT standards occurs after 14 years of service using ALS with permits integrated and 6 hour traffic count for VCD.
Fatigue Cracking Threshold: 20% • Final fatigue cracking percent at 20 years using only WisDOT standards occurs after 15 years of service using ALS with permits integrated and 6 hour traffic count for VCD.
Analysis of Results • WisDOT standards for AASHTOWare of pavement design does not take OW trucks into consideration. • VCD and ALS traffic data could lead to most accurate results. • Final stresses of pavement occurring after 20 years of service showed up years earlier using VCD of WI-140 along with OW traffic integrated into ALS.
Future Research • Locate roadways with heavy truck traffic and analyze pavement in Illinois, Iowa, and Minnesota conducting field surveys.
Summary • Certain state highways with high OW traffic (and high regular truck traffic) have serious pavement problems, such as WI-140. • Future research will utilize MEPDG to explore effects of OW and SHL trucks on pavement.
Acknowledgements • CFIRE for the financial support of this project. • WisDOT for providing permit data (Kathleen Nichols, Lynn Judd, and Ed Lalor) • IADOT for providing permit data (Paul Trombino III, Phou Baccam, and Randal Anderson)
Questions? Contact: Dr. Hani Titi, titi@uwm.edu Valbon Latifi, vlatifi@uwm.edu Nicholas Coley, njcoley@uwm.edu