Download
1 / 38
380 likes | 599 Views
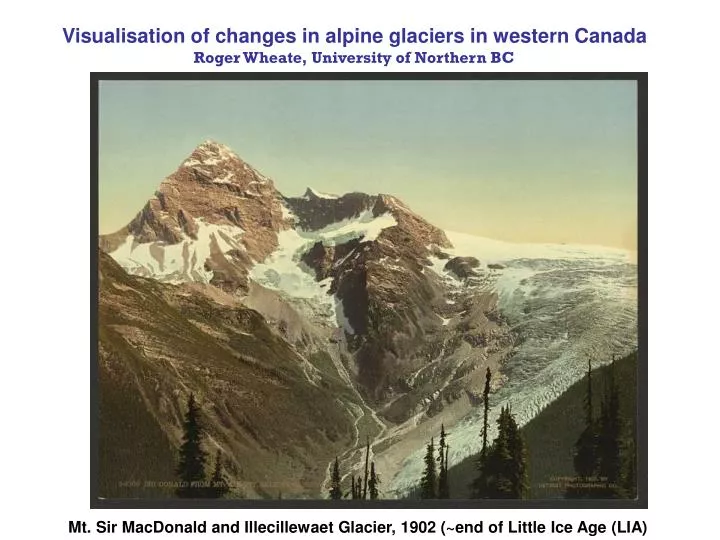
Visualisation of changes in alpine glaciers in western Canada Roger Wheate, University of Northern BC. Mt. Sir MacDonald and Illecillewaet Glacier, 1902 (~end of Little Ice Age (LIA). Illecillewaet Glacier, Glacier National Park. 1885. 2011. Thompson Glacier, Axel Heiberg Island, 1965.

E N D
Visualisation of changes in alpine glaciers in western CanadaRoger Wheate, University of Northern BC Mt. Sir MacDonald and Illecillewaet Glacier, 1902 (~end of Little Ice Age (LIA)
1981 Columbia Icefieldelevation data are not updated: roads, glaciers from 1980; contours from 1960
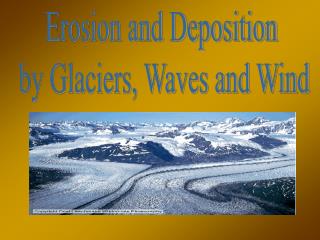
Western Canada (BC / Alberta) ~15,000 glaciers BC ~25,000 km2 Alberta: 1,000 km2
Mt. Edziza1965 yellow1982 red(from air photo mapping)2005 white(Landsat)accumulation area - black
Maligne Lake glaciers, Jasper NP Maligne Lake area 1930-2010: total loss of 33.07 km2 (from 79.5 km2) or - 0.52% per year. Between 2000 and 2010, the rate increased to 2.23% per year
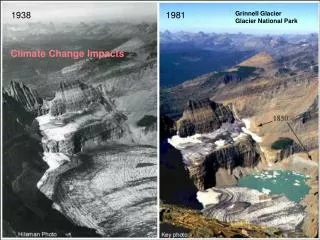
ThinningRetreat Sources: map contours, stereo photography, spaceborne DEMs: e.g. SRTM, ASTER GDEM Current changes ~ -5m/year Sources: maps, air photos, satellite images Current changes ~ -20m/year
Techniques for showing elevation change(DEM subtraction: Haeberli and Paul, 2009)
Hoodoo Glacier: extents 1965 to 2005 (overlain on Landsat TM 2010)1965, 1982 from aerial photos, 1999 and 2005 from Landsat
BC ‘TRIM’ mapping 1982: digital stereophotography; geobase.ca
Salmon Glacier areaAlaska / BC NTDB 1965
Severnaya Zemlya: Glacier changes 1980-2000s dib.joanneum.at/smaragd
GlobGlacier workshop, Zermatt 01/09/2010 Landsat image, Zermatt 01/09/2010 downloaded 03/09/2010 – geotiff (free Landsat archive: glovis.usgs.gov)
Final slide* Visualisation images to be displayed at: glacierchange.org (public input website run by Ph.D student Matt Beedle)* New millennium global glacier extents: glims.org/RGI/randolph.htmlAcknowledgementsThanks to reviewers commentsSelected images by :Anastasia Gurov, Ulrike Schinke, Jacob Trultzch (Dresden TU)Sabrina Marx, Marlene Baumgart (Bonn, Heidelberg)