Download
1 / 9
90 likes | 98 Views
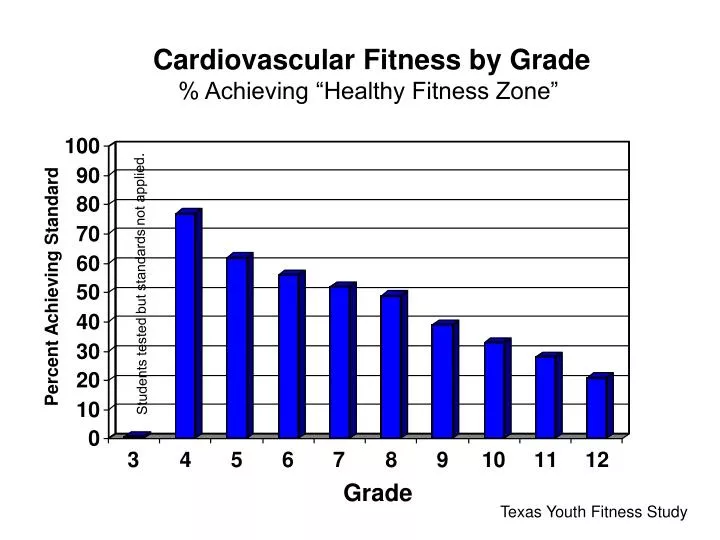
Cardiovascular Fitness by Grade % Achieving “Healthy Fitness Zone”. Percent Achieving Standard. Students tested but standards not applied . Grade. Texas Youth Fitness Study. Body Mass Index (BMI) by Grade % Achieving Healthy Fitness Zone. Percent Achieving Standard. Grade.

E N D
Cardiovascular Fitness by Grade % Achieving “Healthy Fitness Zone” Percent Achieving Standard Students tested but standards not applied. Grade Texas Youth Fitness Study
Body Mass Index (BMI) by Grade % Achieving Healthy Fitness Zone Percent Achieving Standard Grade Texas Youth Fitness Study
Association Between Fitness and Academic Performance (TAKS) Texas Youth Fitness Study 0.54 All students from all eligible schools 0.30 Spearmen correlations between % achieving HFZ and % achieving TAKS standards adjusted for SES, minority % and school size Correlation Coefficient Higher Levels of Fitness Associated with Better Academic Performance
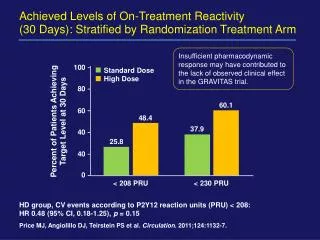
Association Between Fitness and School Attendance Rates Texas Youth Fitness Study 0.52 All students from all eligible schools Spearmen correlations between % achieving HFZ and % attendance (PEIMS data) adjusted for SES, minority % and school size Correlation Coefficient 0.18 Higher Levels of Fitness Associated with Better School Attendance
Association Between Fitness and School Incidence Rates Texas Youth Fitness Study -0.52 -0.24 All students from all eligible schools Spearmen correlations between % achieving HFZ and % of negative incidence adjusted for SES, minority % and school size Correlation Coefficient Higher Levels of Fitness Associated with Fewer Negative School Incidents
CV Fitness Corresponds with Academic Performance when Schools Stratified by State Rating System CV TAKS Percent Achieving Standards School Ratings Texas Youth Fitness Study
Distribution of CV Fitness AND TAKS Achievement by County Counties with low or high levels of achievement in CV fitness also tended to have corresponding low or high levels of achievement on TAKS. Causality can’t be assumed but associations are apparent.
Distribution of BMI Achievement AND TAKS Achievement by County Counties with low or high levels of achievement in BMI also tended to have corresponding low or high levels of achievement on TAKS. Causality can’t be assumed but associations are apparent.
Summary of Texas Youth Fitness Study Initial Results • Significant associations were consistently found between physical fitness and various indicators of academic achievement. • The results were controlled for the influence due to school social economic status, minority status and school size. • The consistent relationships observed support the thesis that physical fitness is associated with academic achievement in school aged youth. These are cross-sectional results and cannot be used to infer causality.