Download
1 / 29
290 likes | 404 Views
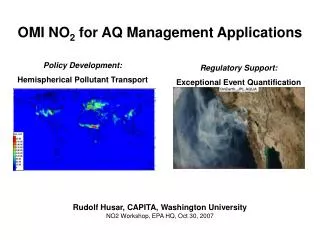
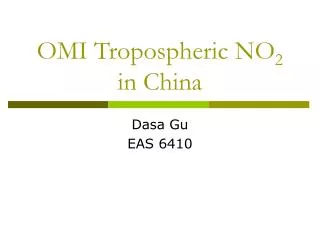
Properties of Urban NO 2 Fields from OMI Measurements. Edward A. Celarier UMBC/GEST James F. Gleason NASA/GSFC Thomas P. Kurosu HSAO/CfA Jennifer G. Murphy U of Toronto Jeffrey A. Geddes U of Toronto Eric J. Bucsela SSRI, Inc. Bojan R. Bojkov UMBC/GEST Christian Retscher UMBC/GEST.

E N D
Properties of Urban NO2 Fields from OMI Measurements Edward A. Celarier UMBC/GEST James F. Gleason NASA/GSFC Thomas P. Kurosu HSAO/CfA Jennifer G. Murphy U of Toronto Jeffrey A. Geddes U of Toronto Eric J. Bucsela SSRI, Inc. Bojan R. Bojkov UMBC/GEST Christian Retscher UMBC/GEST American Geophysical Union Spring Meeting 2008
OMI in a Nutshell EOS-Aura Spacecraft ORBIT: Polar, sun-synchronous, 97 minute period Key component of the A-Train 1345 Local equator crossing time (ascending node) OPERATIONS: Launched July 15, 2004 Nearly flawless, continual operation since launch to present
OMI in a Nutshell OMI Instrument Hyperspectral radiometer Three spectral bands UV1 270-314 nm UV2 306-380 nm Visible 350-500 nm Simultaneous spectra in 60 fields of view cross-track, covering 2600 km Scan is just wide enough that scans from successive orbits “touch” at equator
OMI in a Nutshell Level-2 (and some Level-3) products being produced from OMI measurements: Ozone O3 Total column Nitrogen dioxide NO2 Total, stratospheric, tropospheric columns Aerosols Aerosol index, Single-scatt. albedo, opt thick Cloud properties Fractional coverage, height Sulfur dioxide SO2 Bromine oxide BrO Chlorine dioxide OClO Formaldehyde HCHO Glyoxal CHOCHO
OMI NO2 Data Products(Publicly available) • Level-2 • Stratospheric column NO2 • Tropospheric column NO2 • Total column NO2 • Level-2G • Selected Level-2 data fields on 1x1 grid • Level-3 (coming soon) • Total column • Tropospheric column • Cloud-screened (30%)
Ground-based NO2 measurements Thermo Scientific (TECO) 42C instrument Measures NO and NO2. Detection limit ~ 50 pptv NO2 Ubiquitous for air quality measurements in N America. Samples 4-10 m above ground. Measurements made every 1 minute, compiled into 1 hour averages. For comparison to OMI (1330 LT), used 1100 to 1500 window. Measurements may be biased positive due to peroxyacetyl nitrates (PANs).
The Challenge: How to use OMI measurements to complement in situ measurements of NO2? • OMI effectively averages over ~400 km2 regions (comparable to the size of small urban areas), while in situ samplers making point measurements • OMI views an area of interest in its regional context, which can help determine if anomalous NOx events are associated with extra-urban sources, such as forest fires. • OMI measures integrated column NO2, while samplers measure at fixed height in the boundary layer
OMI vs. Ground-Based Measurements – a start Can we assume … … that the GB measurement is made in a well-mixed layer? … that time-averaged GB measurements reflect spatial averages over moderate distance scales? … that OMI tropospheric NO2 columns are dominated by the boundary layer in urban setting? (I.e. no comparable amount in the free troposphere.)
Results Timeseries of OMI/in-situ ratio (monthly means)
Results Monthly climatological average ratio OMI/in-situ
Discussion • OMI can’t “see” NO2 below clouds • To make statistical comparison, the OMI and GB data sets were subjected to the same cloud filtering • The monthly filtered averages in cloudy months are not necessarily representative of the actual below-cloud concentrations • Photochemistry is different below clouds • Dynamics of vertical mixing is different on overcast days • May be that not all the variation between winter/nonwinter OMI/GB ratios is due to boundary layer height, but averages of these ratios are very suggestive that it explains a large part of the variation
Discussion • We are studying a number of other locations • We are interested in using OMI to establish climatological NO2 distributions to aid in air quality assessments, and the identification and characterization of anomalous events • The air quality community can use OMI data to understand the in situ measurements in their regional context
Acknowledgments • Ontario Ministry of the Environment • TECO 42c data • Data are publicly available (6-18 months after measurement) at www.airqualityontario.ca • Aura Validation Data Center • NASA Goddard Space Flight Center