Download
1 / 6
60 likes | 152 Views
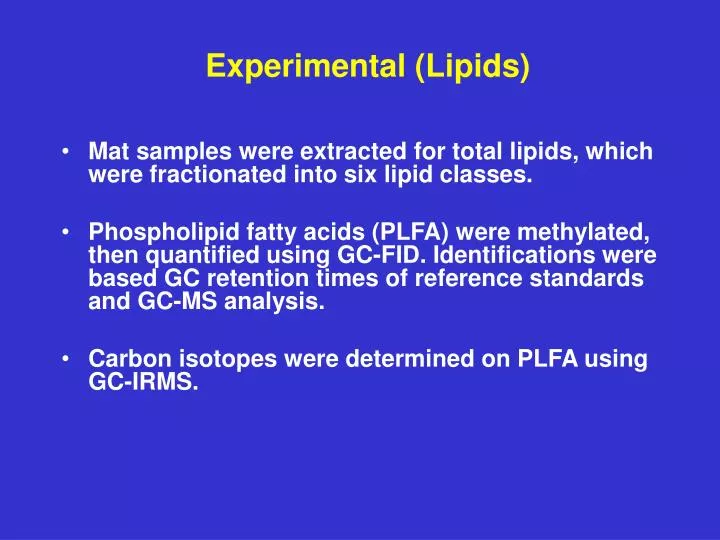
Experimental (Lipids). Mat samples were extracted for total lipids, which were fractionated into six lipid classes. Phospholipid fatty acids (PLFA) were methylated, then quantified using GC-FID. Identifications were based GC retention times of reference standards and GC-MS analysis.

E N D
Experimental (Lipids) • Mat samples were extracted for total lipids, which were fractionated into six lipid classes. • Phospholipid fatty acids (PLFA) were methylated, then quantified using GC-FID. Identifications were based GC retention times of reference standards and GC-MS analysis. • Carbon isotopes were determined on PLFA using GC-IRMS.
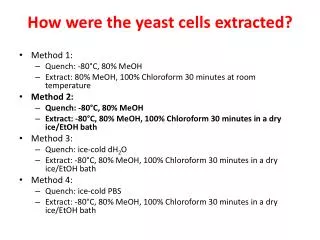
Gas Chromatograms of Microbial PLFA Biomarkers 18:26 18:19c 18:1 7c 16:0 18:0 16:1 7c i15:0 a15:0 19:0 cyc
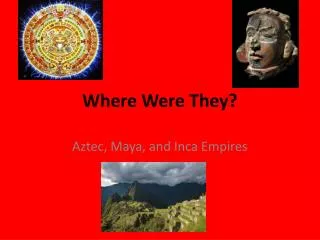
PLFA Biomarkers Arkashin Shaft Rubber Mat CZ#1 North Field Yellow Blue Green (1&2) • 16:0 is the most abundant compound (33-44%), which is universal in all living organisms. • 18:1w7c, 18:1w9c, 18:2w6, 16:1w7c, are also abundant and consistent with biomarkers • characteristic of autotrophic organisms (cyanobacteria, green-sulfur bacteria, and green • non-sulfur bacteria) commonly found in terrestrial hot springs (Zhang et al., 2004). • Biomarkers of heterotrophic bacteria, such as iso- and anteiso-15:0 are low (2-8%). • Results indicate that bacterial biomass production is dominated • by autotrophic organisms in the Kamchatka hot springs. 50 40 30 % 20 10 0 20:0 19:0 cyc a19:0 i19:0 18:0 18:1w7c 18:1w9c 18:2w6 17:0 cyc a17:0 i17:0 16:0 i16:0 16:1w7c 15:0 a15:0 i15:0 fatty acids 14:0 12:0 Zhang, Mills and Romanek
Carbon-Isotope Fractionations Associated with Known Autotrophic Microorganisms [ ] (1000 + d13Cfatty acid) e(‰) = –1 x 1000 (1000 + d13Cbiomass) 15 R-TCA 10 5 FA-Biomass Calvin Cycle 3-HP 0 e -5 -10 Algae Aquificales Green sulfur Green non-sulfur Cyanobacteria
Carbon-Isotope Compositions of PLFA and Total Carbon In Kamchatka Hot Springs FLFA Arkashin Rubber Mat CZ#1 Yellow Blue Green (1&2) i15:0/a15:0 -13.7 -29.8 i16:0 -28.2 a16:0 -25.2 16:1w9c -18.6 -27.9 16:0 -31.1 -17.0 -28.9 -23.1 -15.6 i17:0/a17:0 -29.8 18:2w6 -18.1 -32.1 -22.2 -18.0 18:1w9c -28.7 -17.0 -29.8 -22.2 -16.3 18:1w7c -31.1 -22.2 18:0 -29.3 -21.7 -29.6 -19.1 19:0cyc -30.4 Total PLFA -29.7 ± 1.0 -17.7 ± 2.6 -29.8 ± 1.3 -22.5 ± 0.5 -18.8 ± 3.8 Total Organic C -18.8 -11.38 -25.1 -22.0 -9.8 ePLFA-TOC -11.1 -6.4 -4.7 -0.5 -9.1 Zhang, Mills, and Romanek
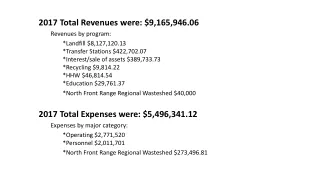
Comparison of Carbon-Isotope Fractionations FA-Total carbon e Pure Cultures Kamchatka Mats 15 15 R-TCA 10 10 5 5 FA-Biomass Calvin Cycle 3-HP 0 0 Yellow Blue e CZ#1 North Field -5 -5 Rubber Mat Green (1&2) -10 -10 Arkashin Algae Aquificales Green sulfur Green non-sulfur Cyanobacteria -15 Zhang, Mills, Romanek