Download
1 / 23
230 likes | 331 Views
Industry Statistical Update 2005. Lester Jones January 8, 2006. Domestic Production and Imports 2004 vs. 2005est (1,000s of Barrels). Year may end flat when all the data are in -- 2004 and 2005 still have significant revisions to review from TTB reporting and State reporting.

E N D
Industry Statistical Update2005 Lester Jones January 8, 2006
Domestic Production and Imports 2004 vs. 2005est (1,000s of Barrels) Year may end flat when all the data are in -- 2004 and 2005 still have significant revisions to review from TTB reporting and State reporting. Source: Beer Institute, 2006
FET doubled from $9 to $18 Estimated 2005 to end year down -1.2% (-2,100 Barrels) Domestic Production (Tax Paid) of Malt Beverages1984 – 2005est (1,000s) Source: Beer Institute and TTB, 2006
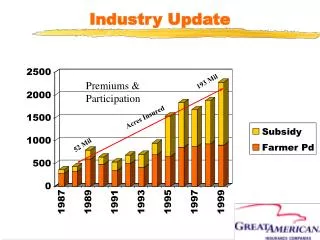
Expect Imports to grow to over 25 million barrels for 6.5% gain in 2005 Imports of Malt Beverages31 Gallon Barrels (1,000s)1984 – 2005 Share will grow over 12% of market in 2005 Over the last thirty years, the share of all imports in US GDP has more than doubled - rising from 4.8 percent in 1972 to 11.5 percent in 2002. In 1972 the US imported 74,667 varieties of goods and in 2001 there were 259,215 varieties. (FRB NY Staff Report 180) Source: Commerce Department, Bureau of Census
Shipments and GrowthTop 10 States YTD November 2005 Over 560,000 barrels off from 2004 in top 10 states where top 10 states account for 53% of volume. Source: Beer Institute, 2006
Top 10 Growth StatesYTD November 2005 Our top 10 fastest growing states added 766,000 barrels in 2005. Source: Beer Institute, 2006
Bottom 10 Growth StatesYTD November 2005 But bottom 10 lost over 1.3 million barrels in 2005. Source: Beer Institute, 2006
Share of Shipments • Three State Examples from YTD Shipments • Utah has 0.73% of US LDA population but consumes only 0.48% of total US shipments • North Carolina has 2.93% of the US LDA population and consumes 2.92% of shipments • New Hampshire has 0.45% of US LDA population and consumes 0.64% of total US Shipments Source: Beer Institute, 2006
Share of ShipmentsYTD November 2005 Source: Beer Institute, 2006
Share of Shipments SummaryYTD November 2005 19 states that index below 100 for share of consumption and account for almost 1 million barrel decline. Source: Beer Institute, 2006
Wine Preferred Over Beer for the First Time in Gallup Poll 695 respondents can’t be wrong (Margin of error +/- 4 pt) Source: Gallup Poll, 2005: Do you most often drink beer, wine, or liquor?
Over 92 Million People Drank Beer in Past 30 Days! 208 x 44% = 92 million legal drinking age consumers 208 x 35% = 73 million 208 x 33% = 67 million Source: Scarborough Research 2005 (Sample of over 70,000 respondents: Beer and Spirits are drank in past 30 days and Wine is purchased past 3 months)
Beer Gets the Share of Alcohol BudgetSpending by Household Income Across almost all income categories, beer gets the greatest share of household alcohol budget ($459/year)…Regressivity debate Source: 2004 Consumer Expenditure Survey, BLS.
Beer, Still the Largest Segment in the Alcohol Beverage Industry Source: Beer Institute and Adams Beverage Group, 2005
Consumer Price Index Beer, Wine, and Spirits at Home2001 to 2005 (YTD-Nov) Source: BLS, Beer, Wine and Sprits at Home, Seasonally Adjusted.
Consumer Price Index Beer at HomeThrough November 2005 Source: BLS, Beer at Home, Seasonally Adjusted, 2005.
Per Capita Beer Consumptionvs. Median Age1980 – 2004 Since 1994, Light/Low Carb, Imports, and Craft have kept the Industry at a steady state. Source: Beer Institute, 2005.
Per Capita Consumption1970 – 2004 Assuming a 3.5% growth rate and 1% population growth, it will be just 4 years before the wine industry gets back to its 1986 peak of 2.4 gallons per person. Assuming a 4% growth rate and 1% population growth, it will be 14 years before the spirits Industry gets back to its 1978 peak of 2 gallons per person. Source: Beer Institute, 2005.
Per Capita Ethanol1970 – 2004 1980s - 13% of Pop 21-27 yrs 2000 - 10% of Pop 21-27 yrs Assume 4.5% for beer, 14% for wine and 40% for spirits Source: Beer Institute, 2005.
2005 State Excise TaxesTop 10 and Bottom 10 States Source: Beer Institute, 2004 - Excludes local and state wholesale taxes.
Average Weighted State TaxPer 31 Gallon Barrel1973 - 2004 $7.85 in 1993 $7.71 in 2004 $4.58 in 1973 Source: Beer Institute, 2005.
Thank You! Beer Institute 2004 Lester Jones ljones@beerinstitute.org 202-737-2337