Download
1 / 1
10 likes | 108 Views
Q U. Q L. Catch. Catch. ~110 a 1. Low. Q. fitting: 2,500. Log of Cross-Correlation Intensity [au]. High. Q. fitting: 23,100. ~110 a 1. Double Waveguide Model. Time. Introduce a second waveguide to now have two controllable ports for manipulating access to the cavity. -20. -20.

E N D
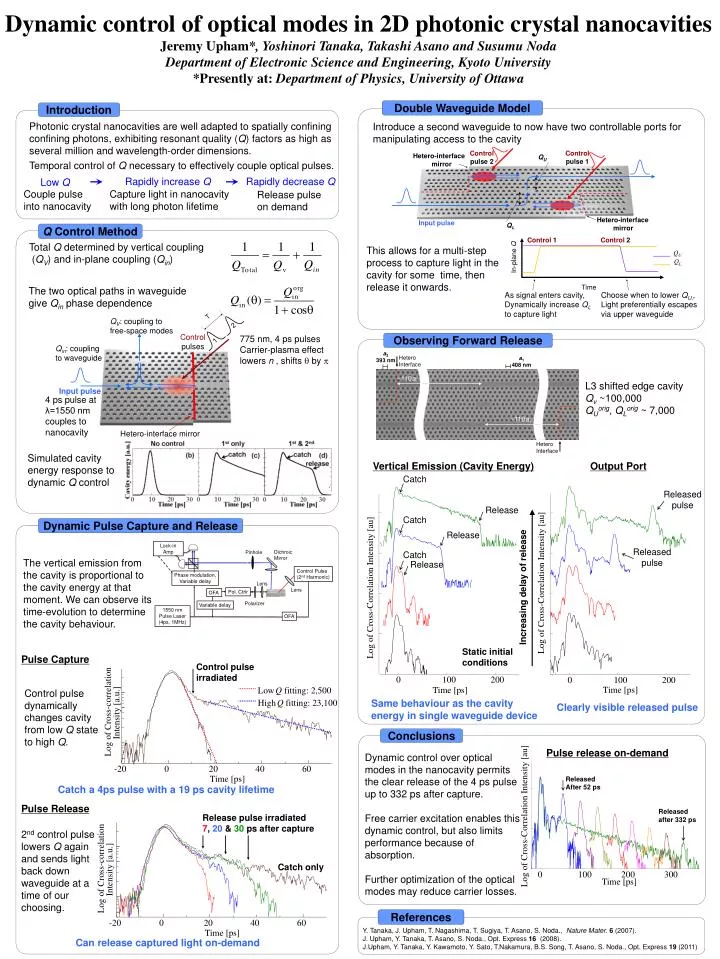
QU QL Catch Catch ~110a1 Low Q fitting: 2,500 Log of Cross-Correlation Intensity [au] High Q fitting: 23,100 ~110a1 Double Waveguide Model Time Introduce a second waveguide to now have two controllable ports for manipulating access to the cavity -20 -20 0 0 20 20 40 40 60 60 Time [ps] Time [ps] Control pulse 2 Control pulse 1 QU Hetero-interface mirror Input pulse Hetero-interface mirror QL This allows for a multi-step process to capture light in the cavity for some time, then release it onwards. Control 1 Control 2 In-plane Q Observing Forward Release As signal enters cavity, Dynamically increase QL to capture light Choose when to lower QU,, Light preferentially escapes via upper waveguide Release Release Release Catch Log of Cross-Correlation Intensity [au] Control pulse irradiated Static initial conditions 0 100 200 0 100 200 Time [ps] Time [ps] Log of Cross-correlation Intensity [a.u.] Conclusions Released After 52 ps Release pulse irradiated 7, 20 & 30 ps after capture Released after 332 ps Catch only Log of Cross-correlation Intensity [a.u.] 0 100 200 300 Time [ps] References Y. Tanaka, J. Upham, T. Nagashima, T. Sugiya, T. Asano, S. Noda., Nature Mater. 6 (2007). J. Upham, Y. Tanaka, T. Asano, S. Noda., Opt. Express 16 (2008). J.Upham, Y. Tanaka, Y. Kawamoto, Y. Sato, T.Nakamura, B.S. Song, T. Asano, S. Noda., Opt. Express 19 (2011) Dynamic control of optical modes in 2D photonic crystal nanocavities Jeremy Upham*, Yoshinori Tanaka, Takashi Asano and Susumu Noda Department of Electronic Science and Engineering, Kyoto University *Presently at: Department of Physics, University of Ottawa Lock-in Amp Dichroic Mirror Pinhole Control Pulse(2nd Harmonic) Phase modulation, Variable delay Lens Lens Pol. Ctrlr OFA Polarizer Variable delay Introduction 1550 nm Pulse Laser(4ps, 1MHz) OFA Photonic crystal nanocavities are well adapted to spatially confining confining photons, exhibiting resonant quality (Q) factors as high as several million and wavelength-order dimensions. Temporal control of Q necessary to effectively couple optical pulses. Rapidly increase Q Rapidly decrease Q Low Q Couple pulse into nanocavity Capture light in nanocavity with long photon lifetime Release pulse on demand Q Control Method Total Q determined by vertical coupling (QV) and in-plane coupling (Qin) The two optical paths in waveguide give Qin phase dependence T QV: coupling to free-space modes 2 Control pulses 775 nm, 4 ps pulses Carrier-plasma effect lowers n , shifts by 1 Qin: coupling to waveguide a2 393 nm Hetero Interface a1 408 nm L3 shifted edge cavity Qv ~100,000 QUorig, QLorig ~ 7,000 Input pulse 4 ps pulse at λ=1550 nm couples to nanocavity Hetero-interface mirror Hetero Interface Simulated cavity energy response to dynamic Q control Vertical Emission (Cavity Energy) Output Port Dynamic Pulse Capture and Release Released pulse Released pulse The vertical emission from the cavity is proportional to the cavity energy at that moment. We can observe its time-evolution to determine the cavity behaviour. Increasing delay of release Pulse Capture Control pulse dynamically changes cavity from low Q state to high Q. Same behaviour as the cavity energy in single waveguide device Clearly visible released pulse Pulse release on-demand Dynamic control over optical modes in the nanocavity permits the clear release of the 4 ps pulse up to 332 ps after capture. Free carrier excitation enables this dynamic control, but also limits performance because of absorption. Further optimization of the optical modes may reduce carrier losses. Catch a 4ps pulse with a 19 ps cavity lifetime Pulse Release Log of Cross-Correlation Intensity [au] 2nd control pulse lowers Q again and sends light back down waveguide at a time of our choosing. Can release captured light on-demand