Download
1 / 1
10 likes | 89 Views
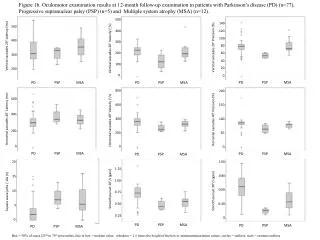
Figure 1a. Oculomotor examination results at baseline in patients with Parkinson’s disease (PD) ( n =105), Progressive supranuclear palsy (PSP) (n=11), Multiple system atrophy (MSA) (n=19) and controls (n=38). . 400. 800. 250. 700. 200. 300. 600. 150.

E N D
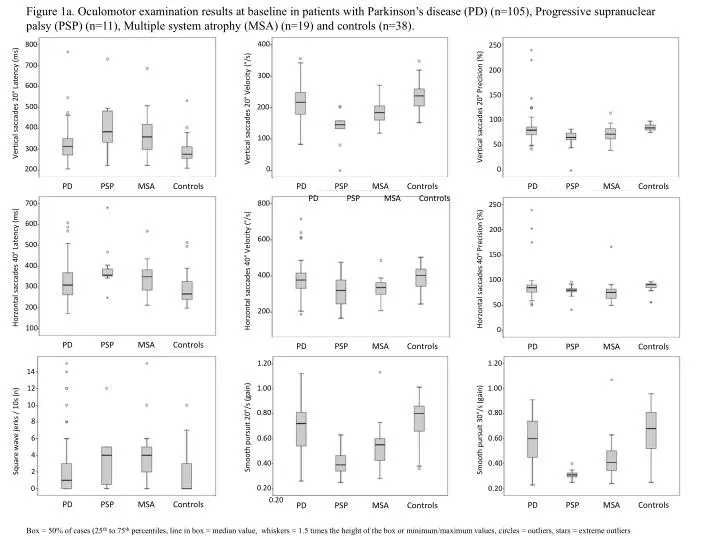
Figure 1a. Oculomotor examination results at baseline in patients with Parkinson’s disease (PD) (n=105), Progressive supranuclear palsy (PSP) (n=11), Multiple system atrophy (MSA) (n=19) and controls (n=38). 400 800 250 700 200 300 600 150 Vertical saccades 20° Latency (ms) 500 Vertical saccades 20° Precision (%) 200 Vertical saccades 20° Velocity (°/s) 100 400 100 50 300 200 0 0 PD PSP MSA Controls PD PSP MSA Controls PD PSP MSA Controls PD PSP MSA Controls 700 800 250 600 200 600 500 150 400 Horzontal saccades 40° Latency (ms) Horzontal saccades 40° Precision (%) Horzontal saccades 40° Velocity (°/s) 400 100 300 50 200 200 100 0 PD PSP MSA Controls PD PSP MSA Controls PD PSP MSA Controls 1.20 1.20 14 12 1.00 1.00 10 0.80 0.80 8 Smooth pursuit 20°/s (gain) Smooth pursuit 30°/s (gain) Square wave jerks / 10s (n) 6 0.60 0.60 4 0.40 0.40 2 0.20 0 0.20 0.20 PD PSP MSA Controls PD PSP MSA Controls PD PSP MSA Controls Box = 50% of cases (25th to 75th percentiles, line in box = median value, whiskers = 1.5 times the height of the box or minimum/maximum values, circles = outliers, stars = extreme outliers