Download
1 / 23
230 likes | 331 Views
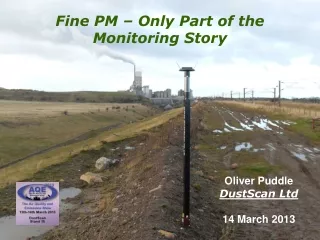
PM fine Quantification. Perceptions about Ammonia Slip , Acid Gases, Condensable Particulate Matter and Applicable Test Methods. Ron Myers OAQPS/SPPD/MPG 1/30/2013. Presentation Topics. Archaeology Philosophy Recent History Current Activities Future. History. PM-10 NAAQS

E N D
PMfine Quantification Perceptions about Ammonia Slip, Acid Gases, Condensable Particulate Matter and Applicable Test Methods Ron Myers OAQPS/SPPD/MPG 1/30/2013
Presentation Topics • Archaeology • Philosophy • Recent History • Current Activities • Future
History • PM-10 NAAQS • Recognized condensable PM impact • Crustal PM was cause of most non-attainment areas • Condensable PM was a small consideration • Condensable PM method proposed in 1990 • Was a “Consensus Method” addressing several State specific compliance test methods • Incorporates several analytical options
1990 EPA Method 202 • Collects PM in impinger water • Similar to 1971 back half PM method • Nitrogen purge added • Added stabilization of Sulfuric Acid • Reflected several State/local methods • Allowed several options • Air purge • No purge • Analysis of some components
Method 202 (cont) • Intent was to replicate ambient air emissions (see Quotes from NSPS) • PM is defined by the conditions • Temperature • Concentration • Pressure • All 1990 M202 options generated different emissions values • No Referee Method available in 1990
Measurement/Monitoring Drivers • PM fines NAAQS • Permits Program • Enhanced Monitoring • Consolodated Emissions Reporting Rule • Significant emissions increase w/ CPM addition • Industry “artifacts” concern
Assessment of 1990 Method 202 • Conducted Laboratory Study • SO2bubbled through impingers • 300 ppm for 1 & 3 hours • 50 ppm for 6 hours • Nitrogen purge and no purge • No ammonia
Recent Activities • Revised Method 201A & 202 • Eliminated options • Reduced initial impinger water • Required purge • Required back up impinger • Dilution Sampling for PM • Research Methods • OAQPS developed Method
Method 202 Improvement • Expand Lab Study • Purge Only • Expand SO2 conc • Modify glassware • Collaborate with stakeholders
Important PM2.5 Method Dates • Final PM Implementation Rule • April 25, 2007 • FR Vol 72, No 79, pg 20586 • Proposed Test Methods • March 25, 2009 • FR Vol 74, No 56, pg 12970 • Final Test Methods • December 21, 2010 • FR Vol 75, No 244, pg 80118
Residual PM Testing Concerns • Method 202 > SO3 • Ammonia reactions • CPM still dominates PM2.5 emissions • Permit limits exceeded
Example Measurement Issue • Coal fired utility boiler • Catalytic Reduction for NOX • Permit limit for NOX & PM10 • Failed annual PM compliance test • PM10 was 5x limit • CPM was 95% (NH4)SO4 • NH3 slip measured at 57 ppm • SO3 measured at 0.4 ppm • Stack test consultant concluded PM was primarily “artifact”
Resolution of Measurement Issue • Retested with several test method changes • Increased sample rate • Increased condenser temperature … • Same results • Replaced catalyst bed 2 years early • Reduced NH3 slip to 1 ppm • CPM emissions reduced by 90% • New Plant Manager hired • New Test Contractor hired
Next Example Measurement Issue • Biomass Boiler • Noncatalytic reduction during O3 season • FF for PM control • PM (M5 & 202) test results • w/o NH3 injection - 0.004 #/mmBtu • w/ NH3 injection - 0.02 – 0.04 #/mmBtu • CTM 039 results – 0.007 #.mmBtu • Sampling issues • Water • Filter
Interest in CTM 039 Increasing • National Academy encouraged use of dilution sampling • EPA developed system • Potential benchmark for “artifact” elimination • Potential for use with extended sampling times • Development of speciation profiles • EPA continues to encourage further development
Video of OAQPS DST This link will take you to the 2 min video of the OAQPS Dilution Sampling System. You need to have Windows Media Player to view this slide of the presentation.
Future • PM condensables are increasingly important • Continued concerns by industry • Several methods are available to accurately quantify condensable PM • Continuous Monitoring Systems are on the Horizon • Several CPM control technologies available
Open Discussion • QUESTIONS?