Download
1 / 27
270 likes | 275 Views
GeoDec is a platform developed by the University of Southern California that rapidly and accurately builds information-rich and realistic geospatial spaces with a temporal dimension, supporting visualization, querying, and data analysis capabilities. It addresses challenges such as realistic rendering, information fusion, interactive query and access, scalable infrastructure, and efficiency in time-to-build. GeoDec has a wide range of applications in city planning, emergency response, military intelligence, simulation and training, computer games, real estate, news broadcasting, and more.

E N D
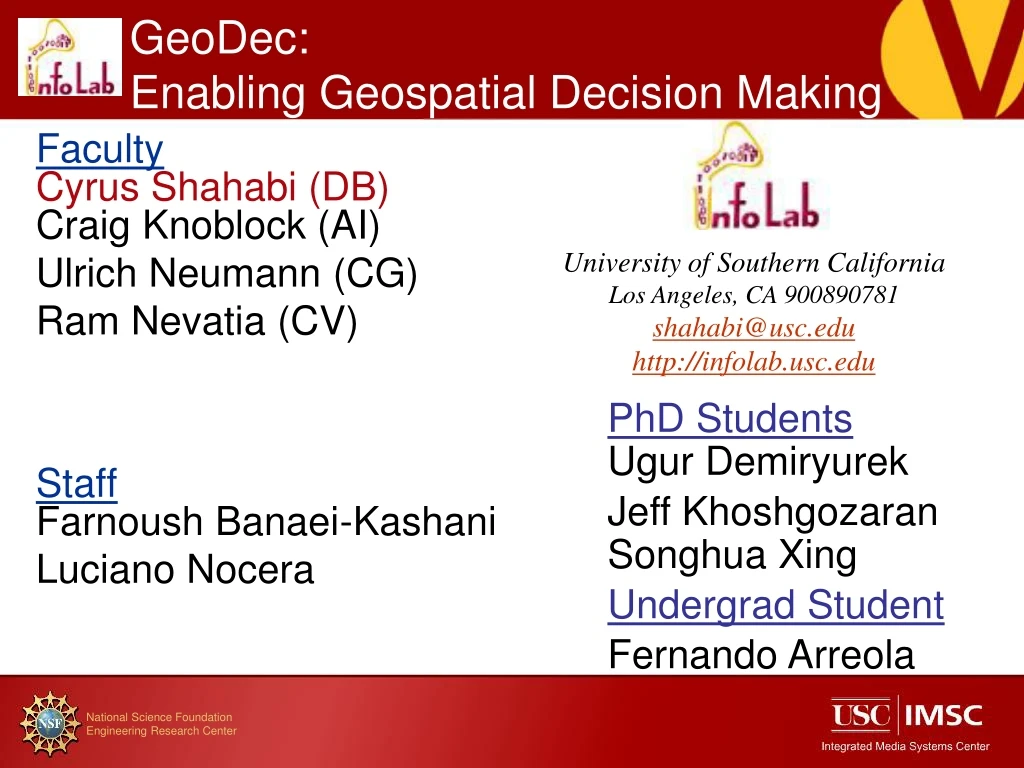
GeoDec: Enabling Geospatial Decision Making University of Southern California Los Angeles, CA 900890781 shahabi@usc.edu http://infolab.usc.edu PhD StudentsUgur Demiryurek Jeff KhoshgozaranSonghua Xing Undergrad Student Fernando Arreola FacultyCyrus Shahabi (DB)Craig Knoblock (AI) Ulrich Neumann (CG) Ram Nevatia (CV) StaffFarnoush Banaei-Kashani Luciano Nocera
Vision (What?): Rapidly and accurately building an information-rich and realisticgeospatial space (e.g., a city) with temporal dimension, supporting visualization, querying and data analysis capabilities Challenges (How?): Realistic rendering Accurate information fusion Interactive query and access Scalable infrastructure Efficient in time-to-build Applications (Why?): City planners Emergency response and first responders Military intelligence Simulation & training Computer games Real-estate News broadcast GeoDec Mission!
Outline • Underlying Technologies • Building 3D Models • Static and Dynamic Textures • Geospatial Data Fusion • Effective Presentation and Querying • Current Status and Future plan
Outline • Underlying Technologies • Building 3D Models • Static and Dynamic Textures • Geospatial Data Fusion • Effective Presentation and Querying • Current Status and Future plan
Large Site Modeling Example (USC Campus) 3D models with texture rendered in VRML 3D building models rendered in VRML • 256 building components modeled in about two hours
Outline • Underlying Technologies • Building 3D Models • Static and Dynamic Textures • Geospatial Data Fusion • Effective Presentation and Querying • Current Status and Future plan
Textures for building facades(Neumann et. al) • Aerial views provide streets, roofs, and open spaces (parks, plazas, etc…) • Ground views capture building facades • Occlusions from landscaping, poles, architectural protrusions (e.g., entry canopies) need to be removed • Requires fusion of images from multiple perspectives to see behind occlusions – methods to reduce parallax artifacts • Alternatively, portions of the textures need to be synthesized based on building-specific texture patterns • App1-The Grand Ave. Project: • “Allow people to explore the physical location of the Grand Avenue park virtually.” • See: http://www.learcenter.org/html/about/?&cm=grand/3d
Social Image Mapping (SIM) • Improving time-to-build • Collaboration with NSF’s STC at UCLA: CENS: Center for Embedded Networked Sensing
Dynamic Textures from Video Streams • App2-The DC Project: • Five video stream fusion on 3D models in an area at Washington DC
Outline • Underlying Technologies • Building 3D Models • Static and Dynamic Textures • Geospatial Data Fusion • Effective Presentation and Querying • Current Status and Future plan
Goal: Vector, Map and Image Data Fusion(Knoblock & Shahabi) TIGER/Line Vector Data Tram Route/Stop Map Satellite Imagery Automatic Map to Imagery Conflation Automatic Vector to Imagery Conflation Aligned Vector Data overlapped with the 3D model Aligned map overlapped with the 3D Model • App3-The Grand Ave. Project: • “3-D model of the proposed park area that has been enhanced with maps, • road information, still photos, panoramic images and historical information about • the unique art and architecture in the area.” • See: http://www.learcenter.org/html/about/?&cm=grand/3d
Demo: Sponsors: • NSF • IMSC • ITR • PECASE • Google • Annenberg • Microsoft • Chevron • App4-The USC's 125th Anniversary: • Adding moving objects and glove interface
Outline • Underlying Technologies • Building 3D Models • Static and Dynamic Textures • Geospatial Data Fusion • Effective Presentation and Querying • Current Status and future plan
Query Formation/Visualization – Negaah(Shahabi et. al) Negaah – New User Interface • Supports formation of queries with user-defined spatio-temporal parameters • Query types: • Range • Spatial • Temporal • Spatiotemporal • shortest path • nearest neighbor • trajectories • events • objects (3D models, parcels, …) • Line of Sight
MS VE Google Earth Negaah Unified Query Results GUI interface KML Files • Range Queries • Video • Vector Data • Buildings • Tram Location • NN Queries • Shortest Path Queries Jooya Query Results Unified Query Darya Yima Prometheus Video Streams Web pages GIS Datasets Video Streams Semi Automatic Processes Gazetteer Data Satellite/Aerial Images iMVS Static/Dynamic Textures Conflation Vector/Raster Map Temporal Data
Complexapps Scale-up Paradigm Shift Arc GIS Windows Live Local GeoDec Arc Explorer Google Earth Analysis & Process at Applications Analysis & Process distributed between application & data Servers Analysis & Process at Data Servers
So What’s unique about GeoDec? • Not a visualization GUI with data access features added in an ad-hoc manner as an after thought! • Three tier architecture with distribution of code where it belongs • All objects are tagged and indexed spatially and temporally • Access at different tiers: GUI, Web-services, database • Time dimension • Extended querying capabilities • We have the source code! • Go wild! Your ideas will not be hindered by the restricted API!
Outline • Underlying Technologies • Building 3D Models • Static and Dynamic Textures • Geospatial Data Fusion • Effective Presentation and Querying • Current Status and future plan
In the News… Lectures
Where we’re going? • Up to now, the focus was on: • Modeling and visualization • Acquisition, storage, integration of real datasets • Implementing the software architecture • Developing generic query types • Some “toy” applications: DC, USC campus, downtown LA • What’s next: • GeoDec+: Challenges of • Real applications, multidisciplinary collaboration (e.g., NSF CDI pre-proposal: pollution in Megacities w/ Keck School of Medicine, Env. & Civil Eng, Earth Science; School of Architecture) • Dynamic datasets: climate data, pollutant data, transportation data, …
GeoDec+: Vision • Marrying • Information richness of GIS systems • Interaction flexibility of computer games & simulations • Challenge: Query and access of real-world large spatio-temporal data as if they are synthetically generated data • Index 3d data (e.g., surface data) for querying and not just rendering