Download
1 / 49
490 likes | 494 Views
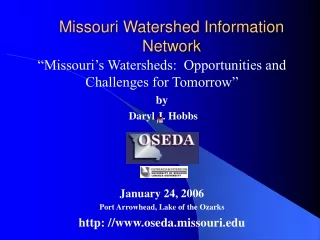
Missouri Student Success Network Missouri Alternative Education Network October 13, 2010 Jefferson City, Missouri. Data Information Knowledge Wisdom. OSEDA…. Http://WWW.OSEDA.MISSOURI.EDU.

E N D
Missouri Student Success Network Missouri Alternative Education Network October 13, 2010 Jefferson City, Missouri
Data Information Knowledge Wisdom OSEDA… Http://WWW.OSEDA.MISSOURI.EDU “The construction of knowledge involves more the orderly loss of information than it’s meaningless accumulation.” -- Kenneth Boulding
Overview • The Social and Economic Context • Educational Needs • Workforce • The Spring MSSN Survey Overall • Use of the Survey for Regional Discussion • Regional Program Profiles • Critical Questions for Collaboration • Contending with Challenging Times
The context of population change in the U.S. Total Population 2009 World: 6.8 Billion U.S.: 307 Million Mo.: 5,987,580
Population Change Missouri 381,515 7% US 24,834,593 9% Change in Population By State 2000 – 2008 Change in Population By State 2000 – 2008 Total Population 2009 World: 6.8 Billion U.S.: 307 Million Mo.: 5,987,580
Relative Concentrations of Growth U.S. Increase 24.8 Million (8.8%) Six States account for 55% * * * * * *
Diverse Trends: Regions within Regions – and within urban areas
Latinos are important part of our growth Growth of the Hispanic Population In Missouri impacts urban as well as rural areas
Population Pyramids of Missouri Percent of Total Population 2000 2020 Male Female Male Female
16 12 26 25 32 32 37
Educational Issues – building expectations From the “Employer” Report:Returns to Associate Degrees
27 percent increase in Dropouts from 2005 to 2009 Source: DESE Web Site, 2010
Diversity in the Dropout Rate ….. Source: DESE Web Site, 2010
The Spring MSSN Survey • Enumeration not a sample n=@ 200 • Average Capacity @ 40 -- high 240 • Half as many girls 30 -- 14 • Half as many part time 15 – 30 • On average 1/3 have some work • More Seniors and Juniors than Freshman and Sophomores • Regional Program Summaries
This program is located: (n=188) 30% Off-campus 29% On-campus (regular school) 24% On-campus (separate building) 17% Other
Does your program offer credits toward graduation? (n=193) 8% No 84% Yes 8% N/A
Number of years the program has been in operation? (n=176) 15% 1-2 26% 3-5 26% 6-10 33% More than 10
Grade levels served by program (n=186) 0% Elementary (K-5) 3% Middle school (6-8) 58% High School (9-12) 39% Other, please explain (4-12)
Major Goal of Program (n=175) 38% Short-term remediation 12% At risk of suspension 50% Difficulty learning
Major Objective of Program Regarding Graduation (n=168) 51% Expectation they will return 11% Condition they must return 39% Expectation they will not return
What type of curriculum do you use in your school? 16% Same curriculum and text as sending school 3% Same curriculum, different text 34% Computerized curriculum 46% Combination of above
Type of Diploma Students Receive (n=173) 92% Regular 8% Alternative
Time Schedule (n=172) 54% Traditional Time Schedule 46% Flexible Time Schedule
To what extent is student entrance is voluntary (n=178) Combination of voluntary, collaborative and involuntary… Yes 68% No 32%
Cost per Pupil: Responses range from $4,500 to $15,000 per year -- but estimates are imprecise
Staffing Administrators 95 Attendance Clerk 57 Behavior Interventionist 34 Counselors 76 Certified Teachers 156 Nurses 42 Paraprofessionals 89 School Resource Officers 37 Security Officers 34 Social Workers 44 Work Coordinators 33
What is the student/teacher ratio? (N=170) 1-6 24% 7-13 52% 14-20 19% 20+ 5%
Who does the alternative school administrator report to in the chain of command? (n=165) 51% Sending school administrator 8% Central Office Curriculum 10% Central Office Student Services 32% Other
Who most influences the decision to Admit a Student… Sending Principal Parent Sending Counselor Alternative School Principal Student
Who most commonly refers students To the program… Sending Principal Sending Counselor Parents Sending School Teachers
Regional Discussions • Review Program Summaries….. • Is there a “critical mass” for Collaboration? If so, on what exactly. • Who are the key stakeholders? • What are the most important aspects of programs? • Can collaboration enhance funding opportunities in challenging times?
16 12 26 25 32 32 37
Missouri Student Success Network Missouri Alternative Education Network October 13, 2010 Jefferson City, Missouri