Download

1 / 19
190 likes | 355 Views
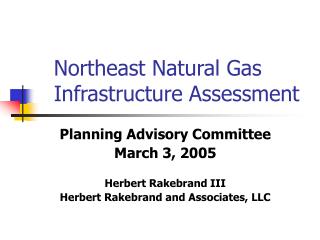
Northeast Natural Gas Market Outlook. Ron Denhardt Vice President, WEFA Energy Services September 2000. Northeast Natural Gas Market Outlook. Ron Denhardt Vice President, WEFA Energy Services October 2000. Overview. AECO - Henry Hub Basis Midwest Flows and Basis

E N D
Northeast Natural Gas Market Outlook Ron Denhardt Vice President, WEFA Energy Services September 2000 Northeast Natural Gas Market Outlook Ron Denhardt Vice President, WEFA Energy Services October 2000
Overview • AECO - Henry Hub Basis • Midwest Flows and Basis • Northeast Demand, Pipeline Capacity and Basis
AECO Basis Formation Before Alliance Western Canada Price Determination Before Alliance 0.4 Marginal AECO Price 0.2 Available Supply For Export 0 Decontr acted: -0.2 Firm Henry Hub - AECO Basis Short- ($US/Mmbtu) Firm Contracts Term Firm Contracts to Contracts -0.4 to NE Services U.S. Midwest to Eastern Canada -0.6 Firm Contracts to Western U.S. -0.8 -1 0 1 2 3 4 5 6 7 8 9 10 11 12 13 14 15 Bcfd
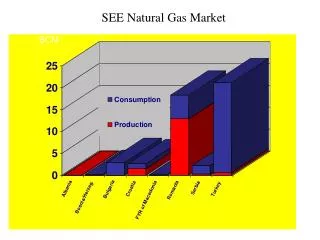
During the spring and summer of 2000 AECO - Henry Hub basis widened because: • Strong gas demand in Southern California caused the Northern - Southern California basis to widen • Eastern Canadian storage was not filled because of high prices • Maintenance on Nova system • Additional supplies coming on from Fort Liard area in BC
Alliance addition of 1.6 Bcfd to Midwest will be greater than 1.1 Bcfd de-contracting on TCPL Bcfd
Major projects are to move gas from Midwest (14.5 Bcfd) to Northeast (11.6 Bcfd) Eastern Canada 3.4 Bcfd New England 1.7 Bcfd VectorSupply Link Independence Market Link Millennium Chicago Dawn NY Leidy Joliet Midwest14.5 Bcfd Middle Atlantic 6.5 Bcfd
Even with Alliance there will be net flows from the Gulf to the Midwest • Net Flow (Bcfd) • Annual 11.5 • Summer 9.8 • Winter 12.2 • Canada + SW 6.8 • Alliance 1.6 Bcfd • Total with Alliance 8.4 Bcfd • Net Gulf 1.4 Bcfd (9.8 - 8.4) Canada 3.7 Bcfd 3.5 Bcfd 96% Capacity Flow Utilization Southwest 4.7 Bcfd 3.3 Bcfd 70% Gulf 7.3 Bcfd 4.7 Bcfd 68%
Net flows to western Midwest from Gulf could be negative during part of the year • Net Flow (Bcfd) • Annual 6.3 • Summer 4.9 • Winter 7.5 • Canada + SW 5.1 • Alliance 1.6 • Total with Alliance 6.7 Bcfd • Net Gulf = -1.8 Bcfd in Summer Canada 3.0 Bcfd 2.8 Bcfd 94% Capacity Flow Utilization Southwest 3.0 Bcfd 2.3 Bcfd 74% Gulf 2.8 Bcfd 1.2 Bcfd 42%
Chicago - Henry Hub basis could go negative part of the year • Positive Henry Hub - Midwest basis could move northeast of Chicago during the non- heating season and Chicago - Henry Hub basis could become negative in the summer • Midwest could reverse flow 600 - 800 MMcfd to Tennessee
Dawn - Chicago basis will depend a great deal on Alberta - Henry Hub basis
De-contracting on TCPL and 80% IT floor will widen Chicago - Dawn basis
The addition of Vector is likely to create excess capacity to Eastern Canada • Vector will add 700 MMcfd from Joliet, Illinois to Dawn, Ontario with near term expansion of 1 Bcfd • Weather normalized Eastern Canadian demand is about 3.4 Bcfd and growing at 1.5% to 2.0% per year (50 to 70 MMcfd). • It would take almost ten years to absorb this capacity on Eastern Canada • Either there must be substantialgrowth, gas must be exported, or delivered en-route
Eastern Canadian Capacity is used at a high load factor Bcfd Flows Utilization Capacity TCPL/GLGT 5.34 5.16 97% Others 1.05 0.07 7% Total 6.39 5.24 82% Export Niagara 0.84 0.81 97% Iroquois 0.81 0.70 87% Other 0.94 0.31 33% Total 2.59 1.83 71% Net Eastern Canada 3.80 3.41 90%
Power Generation is the big upside for gas demand • Loss of 4375 MW nuclear capacity in Ontario could support gas demand growth 180 - 360 MMcfd • Proposed gas combined cycle plants in Ontario equal 3.2 GW about 720 MMcfd at 90% capacity • Environmental regulations put 9.4 GWof coal at risk in Michigan
US Northeast market growth is not likely to absorb all the proposed pipeline capacity CAPACITY PROJECT ( MMCFD) DATE Distrigas 220 June 1999 M&N 440 Dec 1999 Independence 900 Nov 2001 Millennium 700 Nov 2002 Scotian Shelf 900 2005 Total 3160
3.16 Bcfd of additional capacity compare to .8 to 2.4 Bcfd of consumption growth by 2005 • Weather normalized Northeast 2000 consumption 8.4 Bcfd • WEFA’s forecast calls for a 2.6% growth rate over the next decade • 1000 MW Nuclear Unit is about 250 MMcfd • 1% increase in electricity demand 100 MMcfdper year
Potential Capacity Additions to the New England Market Are Huge Compared to the Market Size • 1998 Capacity to New England was 2.7 Bcfd and weather normalized consumption about 1.8 Bcfd (68% capacity utilization) • Capacity additions Distrigas and M&N 640 MMcfd • Another 900 MMcfd from Scotian Shelf • 50% increase in pipeline capacity over next five years
Most likely Northeast can absorb one major project by 2003 (near term - basis will increase substantially with normal winter)
Atlanta Boston Chicago Los AngelesNew York Philadelphia Washington, DC Brussels Frankfurt London Mexico CityMilan Ottawa Paris Pretoria Toronto Atlanta Boston Chicago Los AngelesNew York Philadelphia Washington, DC Brussels Frankfurt London Mexico CityMilan Ottawa Paris Pretoria Toronto