Download
1 / 24
240 likes | 390 Views
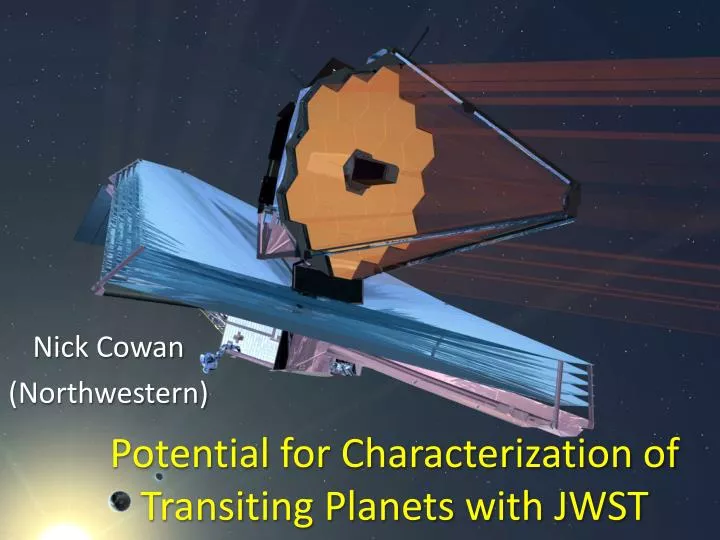
Potential for Characterization of Transiting Planets with JWST. Nick Cowan (Northwestern). Study Analysis Group 10 (SAG-X). What is the full diversity of planet properties needed to characterize and understand the climate of short-period exoplanets?

E N D
Potential for Characterization of Transiting Planets with JWST Nick Cowan (Northwestern)
Study Analysis Group 10 (SAG-X) • What is the full diversity of planet properties needed to characterize and understand the climate of short-period exoplanets? • Which measurement suites and how much observing time are needed to characterize the climate of transiting planets? • Will JWST be able to characterize the atmospheres of transiting terrestrial planets? • Which critical measurements will be too expensive or inaccessible to JWST, and can these be obtained with planned observatories?
SAG-X Participants (so far) Daniel Angerhausen(RPI), Natasha Batalha(Penn State), Adrian Belu(Bordeaux), Knicole Colon (Lehigh), Bill Danchi (Goddard), Pieter Deroo(JPL), Jonathan Fortney (UCSC), Scott Gaudi (Ohio State), Tom Greene (Ames), Matt Greenhouse (Goddard), Joe Harrington (UCF), Lisa Kaltenegger(MPIA), Nikole Lewis (MIT), Chuck Lillie (Lillie Consulting), Mercedes Lopez-Morales (CfA), AviMandell(Goddard), Emily Rauscher (Princeton), Aki Roberge(Goddard), Franck Selsis(Bordeaux), Kevin Stevenson (Chicago), Mark Swain (JPL)
1D Climate Cartoon Tstrat Stratosphere Tropopause Height Thermal Emission Probes Near Tropopause Γ Troposphere Reflected Light Probes Near Surface Temperature Tsurf
1D Climate Cartoon Increase Insolation and/or Decrease Albedo Height Temperature
1D Climate Cartoon Increase Longwave Opacity Height Temperature
1D Climate Cartoon Height Decrease Specific Heat Capacity Temperature
2D Climate Cartoon(eg: height + latitude) • Unfortunately we don’t have robust predictive models for: • Clouds • Atmospheric Loss • Photochemistry • Geochemical Cycling • Wind Velocities • To learn from exoplanets, • we need to measure: • Planetary Albedo • Albedo Gradients • Emitting Temperature • Temperature Gradients • (vertical and horizontal) Height Equator Advection Pole Temperature
Predicting vs Measuring Planetary Climate Model Inputs Model Outputs Emitting Temperature Temperature Gradients Diurnal Response Seasonal Response Cloudiness Surface Temperature Precipitation • Insolation • Eccentricity • Obliquity • Surface Albedo • Greenhouse Gases • Specific Heat Capacity • Surface Gravity • Surface Pressure • Thermal Inertia
Transit Phase Variations
Archetypal Short-Period Planets Hot Earth (CoRoT-7b, Kepler 10b, αCen Bb) Temperate Super-Earth(HD 85512 b, GJ 163 c) Warm Neptune (GJ 1214b, GJ 436b) Hot Jupiter (HD 209458b, HD 189733b, WASP-12b)
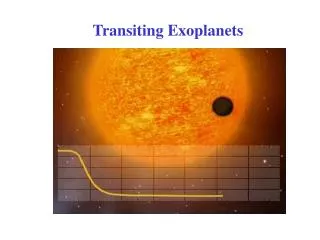
Thermal Light Curve Brightness 100% Transit Depth = (Rp/R*)2 99% Transit Time
Some Transit Depths Hot Earth: 7.3E-5 Temperate Super-Earth: 7.3E-3 Warm Neptune: 2.7E-2 Hot Jupiter: 8.8E-3
Thermal Light Curve Brightness Annulus/Stellar Area = 2RpH/R*2 (where scale height H = kBT/μg) 100% Transit 99% Transit depth is different at different wavelengths Time
Some Transit Spectral Features Hot Earth:2.0E-6 Temperate Super-Earth:6.5E-6 Warm Neptune:2.4E-4 Hot Jupiter:1.2E-4
Thermal Light Curve Star + Planet Star Brightness 100.3% 100% Eclipse Eclipse Depth ≈ (Rp/R*)2 (Tday/T*) 99% Transit Time
Some Eclipse Depths Hot Earth:3.3E-5 Temperate Super-Earth: 7.0E-4 Warm Neptune: 8.1E-3 Hot Jupiter:4.0E-3
Star + Planet Star Thermal Light Curve Brightness 100.3% Transit 100% Eclipse depth is different at different wavelengths 99% Eclipse Spectrum ≈ (Rp/R*)2 (Tsurf - Ttrop)/T* Time
Thermal Light Curve Star + Planet Star Phase Amplitude ≈ (Rp/R*)2 (Tday - Tnight)/T* Brightness 100.3% 100.1% 100% Eclipse Transit Time
Eclipse Spectroscopy vs. Phase Variations • Differences in temperature • Vertical (33-200 K) • Zonal (60-2000 K) • Spectroscopy has to achieve S/N with relatively narrow bandwidth (R>10) • Phase variations require long-term stability
Predicting vs Measuring Planetary Climate Model Inputs Model Outputs Emitting Temperature Temperature Gradients Diurnal Response Seasonal Response Cloudiness Surface Temperature Precipitation • Insolation • Eccentricity • Obliquity • Surface Albedo • Greenhouse Gases • Specific Heat Capacity • Surface Gravity • Surface Pressure • Thermal Inertia