Download
1 / 39
390 likes | 399 Views
URBDP 422 Urban and Regional Geo-Spatial Analysis Lecture 2: Spatial Data Models and Structures Lab Exercise 2: Topology January 9, 2014. Spatial Data Structures. Raster Representation. Vector Representation. point. line. polygon. Spatial Data Structures. Vector data model

E N D
URBDP 422 Urban and Regional Geo-Spatial Analysis Lecture 2: Spatial Data Models and Structures Lab Exercise 2: Topology January 9, 2014
Spatial Data Structures Raster Representation Vector Representation point line polygon
Spatial Data Structures Vector data model • location referenced by x,y coordinates, which can be linked to form lines and polygons • attributes referenced through unique ID number to tables • best for features with discrete boundaries Raster data model • location is referenced by a grid cell in a rectangular array (matrix) • attribute is represented as a single value for that cell • best for continuous features
Raster Vs. Vector Structures ADVANTAGES DISADVANTAGES RASTER - Data input - Data storage - Modelling - Not Topological - Overlays - Accuracy - Continuous surface - Distortion VECTOR - Efficient storage - Complex to - Discrete features perform overlay and - Topology modeling operations - Greater precision
Geographical Data in the Computer A B C D User’s perceived phenomenon structure GIS representation of phenomenon structure Database structure Hardware Structure
Object-oriented Data Bases Feature Object Relationship
Topology Topology is the term that describes the spatial relationships between points, lines and areas. Technically it is a geometrical term, which describes the properties of an object that are unaffected by continuos distortion. You can distort a square to a parallelogram, but all four sides still connect at the corners.
If a map is distorted, some of its properties change: - distances - angles - relative proximity Other properties remain constant, including: - adjacencies - most other relationships, such as "is contained in", "crosses", etc. - types of spatial objects - areas remain areas, lines remain lines, points remain points. Topological properties are those which remain unchanged after distortion
ArcGIS Topology Source: ESRI 2004
How Is Topology Implemented in ArcGIS? Topology is implemented as a set of integrity rules that define the behavior of spatially related geographic features and feature classes. Topology rules, when applied to geographic features or feature classes in a geodatabase, enable GIS users to model such spatial relationships. For example: -Containment (do parcel polygons overlap?) • Connectivity (are all of road lines connected?) • Adjacency (are there gaps between parcel polygons?). Topology is also used to manage the integrity of spatial databases (i.e., coincidence between different features) Source: ESRI 2004
Topology in ArcGIS Topology is used to o Integrate feature geometry o Validate feature geometry o Define relationships between features
Topological Relationships Topology is one of the most powerful information maintained in a spatial database. It is defined as the mathematics of connectivity or adjacency of points or lines that determines spatial relationships in a GIS. The topological data structure logically determines exactly how and where points and lines connect on a map by means of nodes (topological junctions). Topology—the spatial relationships between geographic features—is fundamental to ensuring data quality. The computer stores this information in various tables of the database structure. A GIS manipulates, analyzes, and uses topological data in determining data relationships.
The importance of Topology • Explicit representation of real world • Efficient data input and storage • Efficient data retrieval and query • Construction of complex data object • Detection of data error • Maintainance of data integrity
Topology Rules • Define valid spatial relationships • Between features on a single feature class • Between feature classes • 25 rules available
Examples of topology • Adjacency • Connectivity • Containment • Point-in-Polygon • Polygon-containing-Feature • Intersect • Dissolve Similar • Digital Terrain Analysis
Examples of topology Parcel Contained in Block Roads connects at intersection Shoreline land adjacent to water
SIX New Topological Rules http://help.arcgis.com/en/arcgisdesktop/10.0/help
Constructing Topology Rules Every topology in the geodatabase is associated with a set of topology rules. Users define topology integrity by adding and removing rules from this set. Cluster Tolerance The cluster tolerance is a distance range in which all vertices and boundaries are considered identical or coincident and are snapped together during a Validate Topology process. Ranks Ranks are defined at a feature class level, and they control how much the features in that class can potentially move in relation to features in other classes when a topology is validated.
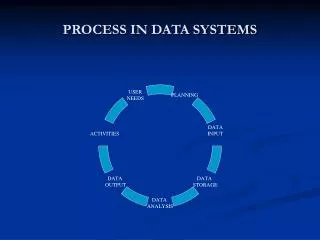
Editfeatures Dirtyareas Create topology Validatetopology Clean Topology Errors Makeexception Rules Rules Cluster tolerance Ranks Exceptions Fixerrors Topology Process ESRI-Denver/AGIC 2005
Validating Topology Validate edited features using set topology rules Evaluate rules/tolerance and generates error notifications Snaps vertices using set cluster tolerance and ranks
Errors and Exceptions Topology defines and validate rules. Rules are defined as part of the schema definition for a topology. When “dirty areas” in a topology are examined with Validate Topology, an error is generated for each instance of a topology rule that is determined to be invalid. For example, if a rule is set that states buildings cannot overlap with easements, then an error will be generated for each building feature that overlaps an easement feature.
Exceptions When resolving errors, the user always has the option of marking an individual error or a collection of errors as exceptions. There are instances when the occurrence of a defined error may actually be acceptable. For example, if a building was actually a shopping mall, the one building overlapping several parcels would not be an error but rather an exception to the rule. Once an error has been marked as an exception, it remains as such until it is reset back to an error. Running validate topology will not generate an error for an instance that has been marked as an exception.
Correcting Errors in the Topology When an error is discovered during the validate topology operation, the user has three options: - Correct the error using the Fix Topology Error tool or some other method. - Leave the error unresolved. - Mark the error as an exception. The Fix Topology Error tool offers a variety of methods for resolving an error depending on the error and the feature type.
Basic Cartographic Concepts • Scale • Resolution • Accuracy • Coordinate system • Projection
Map Scale The map scale is the ratio between a distance on the map to that distance on the ground. Normally, it is expressed as representative fraction e.g. 1 : 10,000. Many other properties of the map are dependent on the map's scale.
1 0 2 Miles Scale • ratio of distance on a map, to the equivalent distance on the earth's surface. • Large scale -->large detail, small area covered (1”=200’ or 1:2,400) • Small scale -->small detail, large area (1:250,000) • scale representation • representative fraction (RF) 1: 63,360 • scale bar:
Resolution • the size of the smallest feature which can be recognized or displayed. • related to, but not the same as, scale. • for vector data it is the size of the smallest polygon • for raster data it is the size of the pixel • e.g. for NTGISC digital orthos is 1.6ft (half meter) • raster data can be resampled by combining adjacent cells; this decreases resolution but saves storage
Map Accuracy The map accuracy refers to how well it represents the spatial locations of map features. Quantitative Accuracy • positional (horizontal) accuracy: distance of a feature in the GIS from true location on the ground (each measured with respect to same grid or graticule) • vertical accuracy: difference from true height Qualitative Accuracy (validity) Completeness (reliability) The extent to which repeated observations on the map produces consistent results.
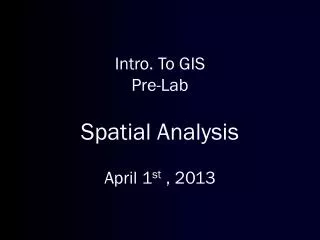
e12 + e22 + e32 +...+ en2 n-1 rmse = where ei is the distance between the true location of point i on the ground, and its location represented in the GIS. Measurement of Accuracy Usually measured by root mean square error: the square root of the average squared errors The rmse tells us how far points are from their true location, on average.
Object-oriented Relational Data Bases ArcGIS uses a geographic data model that represents spatial information as objects, features, raster, and other data types. It integrates two GIS data models, the traditional relational data base model and an object-oriented relational model called a geodatabase. The idea of "object-oriented" database is to organize information into the sorts of “objects" that people recognize. It brings a physical model closer to its logical model. The users work with objects of interests such as buildings, roads, and lakes.