Download
1 / 31
310 likes | 474 Views
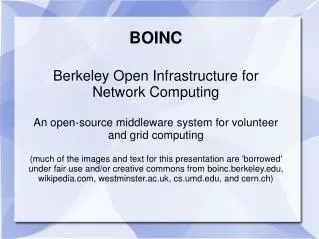
BOINC Application Development Lifecycle. Rom Walton rwalton@ssl.berkeley.edu September 10, 2008. BOINC Application Lifecycle. Developing. Validating. Debugging. Deploying. Developing Apps. Worker applications should call: Graphics applications should call:

E N D
BOINC Application Development Lifecycle Rom Walton rwalton@ssl.berkeley.edu September 10, 2008
BOINC Application Lifecycle Developing Validating Debugging Deploying
Developing Apps • Worker applications should call: • Graphics applications should call: • Benefits of the BOINC Diagnostic Framework • Stack traces on crashes (Win, Linux, Mac) • Prevents the JIT Debugger dialog (Win) • Memory leak detection (Win – VS Debug Builds) • Heap corruption detection (Win – VS Debug Builds) boinc_init_diagnostics( BOINC_DIAG_DEFAULTS ); boinc_init_graphics_diagnostics( BOINC_DIAG_DEFAULTS );
Developing Apps (cont’d) • Platform neutral tips • Use a separate project to test your applications • Windows tips • Use the symbol store technology, if possible • Linux tips • Link application with the BOINC-Build-Compat Virtual Machine. Application binds to older glibc but still contains the optimizations of newer compilers • Mac tips • Build against the Mac OS X 10.3.9 SDK
Developing Apps (cont’d) • Windows Symbol Stores • What are they? • How do they work? • How does the BOINC Framework use them? • How do I configure my Windows machine? • Set environment variable _NT_SYMBOL_PATH to:srv*c:\windows\symbols*http://msdl.microsoft .com/download/symbols • Execute:symchk c:\windows\system32\*.dll /ov
Developing Highlights • Use the BOINC Diagnostic Framework • Traps structured exceptions (Win) • Traps signals (Linux, Mac) • Detects memory leaks (Win) • Detects heap corruption (Win)
BOINC Application Lifecycle Developing Validating Debugging Deploying
Validating Apps • Run through your test workunits • Check for buffer overruns • Win: BOINC_DIAG_HEAPCHECKENABLED • Linux: Valgrind • Check for memory leaks • Win: BOINC_DIAG_MEMORYLEAKCHECKENABLED • Linux: Valgrind • Check for handle leaks • Win: Process Explorer, ntsd (!handles), oh.exe • Linux: lsof
Validating Apps (cont’d) gflags.exe options: • Global Flags (gflags.exe) • Not useful for debugging inthe field • Tweaks the heap manager(works with any type of application) • Only detects buffer overruns for dynamically allocated memory.
Validating Apps (cont’d) • Example memory leak output: • Example handle leak output (oh.exe): Dumping objects -> ..\lib\diagnostics_win.C(642) : {70} normal block at 0x017C3A30, 1068 bytes long. Data: < T > 1C 1A 00 00 54 00 00 00 01 00 00 00 00 00 00 00 Object dump complete. boinc.exe File 0008 \ProgramData\BOINC\stdoutdae.txt boinc.exe Key 0034 \REGISTRY\MACHINE boinc.exe File 0094 \ProgramData\BOINC\stderrdae.txt
Validating Highlights • Test the following once per application release cycle: • Memory leaks • Handle leaks • Heap corruption • Test the following once per application release: • Exception/Signal handling(Abort a task from BOINC Manager)
BOINC Application Lifecycle Developing Validating Debugging Deploying
Deploying Apps • Add application to ‘$project_root/project.xml’. $app_name = Whatever you want to call your application • Execute xadd to add your application to the project. <boinc> <app> <name>$app_name</name> <user_friendly_name></user_friendly_name> </app> </boinc> cd $project_root ./bin/xadd
Deploying Apps (cont’d) • Upload your application and its dependencies to:$project_root/apps/$app_name/$app_ver_name • $app_ver_name is the name of the worker executable • Worker executable name is defined as: • $name_$version_$platform • Execute update_versions t0 add app versions to project Windows: uppercase_6.1_windows_intelx86.exe Linux: uppercase_6.1_i686-pc-linux-gnu Mac: uppercase_6.1_i686-apple-darwin cd $project_root ./bin/update_versions
Deployment Highlights • Application files are assumed to be immutable • update_versions performs the following functions: • Copies application files to download directory • Reads signature file/generates signature file • Adds application to database • Touches feeder restart file
BOINC Application Lifecycle Developing Validating Debugging Deploying
Debugging Apps • 4% - 5% failure rates are not uncommon • Machines overheat • Bad memory • Bad processors • Crash reports are stored inside the BOINC Database • Go to the project_ops web site to look at crash reports • Look for reports that have: • PDB symbols for the application and libraries • Complete stack traces
Debugging Apps (cont’d) • Determine environment is setup correctly • Check that your symbol store is listed BOINC Windows Runtime Debugger Version 5.5.0 Dump Timestamp : 09/09/08 23:41:39 Debugger Engine : 4.0.5.0 Symbol Search Path: srv*C:\DOCUME~1\romw\LOCALS~1\Temp\symbols*http://boinc.berkeley.edu/alpha/symstore;srv*c:\windows\symbols*http://msdl.microsoft.com/download/symbols;srv*C:\DOCUME~1\romw\LOCALS~1\Temp\symbols*http://boinc.berkeley.edu/symstore
Debugging Apps (cont’d) • Determine that the loaded modules have symbols • Symbols may not download • Machine is off-line during crash • Took longer that 30 seconds to download symbol file(s) ModLoad: 00400000 00060000 C:\...\uppercase_6.3_windows_intelx86.exe (PDB Symbols Loaded) ModLoad: 7c800000 000c0000 C:\...\ntdll.dll (5.2.3790.1830) (PDB Symbols Loaded)
Debugging Apps (cont’d) • Crashing thread contains an exception record: • Access Violation (0xC0000005) • NULL references exceptions • Using indexes as pointers • Processor flipping bits because of heat • Breakpoint Encountered (0x80000003) • User aborted an active task • Assertion failure in debug builds - Unhandled Exception Record - Reason: Breakpoint Encountered (0x80000003) at address 0x7C822583
Debugging Apps (cont’d) • Check call stack of crashing thread • Look for the interface point between your application and an OS library. Typically NTDLL.DLL or KERNEL32.DLL - Callstack - ChildEBP RetAddr Args to Child 00aafd60 00402221 00000000 00000000 00000000 00000001 ntdll!_DbgBreakPoint@0+0x0 00aaffb4 0042684e 77e66063 00000000 00000000 00000000 uppercase_5.10_windows_intelx86!worker+0x0 (c:\boincsrc\main\boinc\samples\uppercase\upper_case.c:181)
Debugging Apps (cont’d) • What information is contained in a stack frame • ChildEBP – isn’t really useful • RetAddr – Return Address, should be within the same address space as the previous calling frame • Args to Child – First four parameters to function • Module!Function • Source File:Line Number ChildEBP RetAddr Args to Child 00aaffb4 0042684e 77e66063 00000000 00000000 00000000 uppercase_5.10_windows_intelx86!worker+0x0 (c:\boincsrc\main\boinc\samples\uppercase\upper_case.c:181)
Debugging Apps (cont’d) • When ‘X’ doesn’t mark the spot • Don’t get discouraged • Sample several crash reports • Debugging applications remotely can be hard • One nasty bug in the Rosetta@home application • Only happened during application destruction • I looked at 120 crash reports over the course of 5 days before seeing the common theme • Resource contention between two threads
Debugging Apps (cont’d) • Need extra help? • Add trace statements by logging to stderr • Release a new version of your application • Only you know how your applications really work
Debugging Highlights • BOINC’s diagnostic framework • Processes crashes for you • Dumps relevant information to stderr • No need to manage dump or mini-dump files • No need to understand the specifics of each platforms infrastructure • Easy to enable
Conclusion • BOINC Application Framework: • Mature diagnostic framework • Completely automatic feedback loop • BOINC Client uses the same framework • We eat our own dog food • Should be compatible with all run-time environments • C/C++ • Fortran • Anything that supports calling a C Function
Questions and Answers • BOINC Website:http://boinc.berkeley.edu/ • BOINC Development Mailing List:boinc_dev@ssl.berkeley.edu • BOINC Projects Mailing List:boinc_projects@ssl.berkeley.edu • BOINC Application Debugging:http://boinc.berkeley.edu/trac/wiki/AppDebug Any Questions?
Tools • Debugging Tools for Windows (Windows) • gflags.exe, symchk.exe, symstore.exe, windbg.exe • Web site • Windows Resource Kit Tools (Windows) • oh.exe, dh.exe, consume.exe, clear.exe • Web site • Process Explorer (Windows) • DLL Dependencies, Handle Leak Detection, Real-Time Thread Monitoring (Backtraces) • Web site
Tools (cont’d) • Valgrind (Linux) • Memory Leak Detection, Thread Error Detection • Web site • DDD (Linux) • Graphical Debugger • Web site