Download
1 / 93
960 likes | 1.34k Views
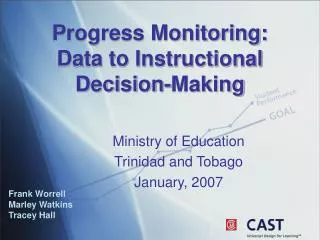
Progress Monitoring and Data-Based Decision Making. Participant Outcomes The participants will be able to …. Explain why progress monitoring is critical in making instructional decisions. Use a seven step process for implementing progress monitoring for students using oral reading fluency.

E N D
Participant OutcomesThe participants will be able to … • Explain why progress monitoring is critical in making instructional decisions. • Use a seven step process for implementing progress monitoring for students using oral reading fluency.
You Gotta Pay Attention to Where You’re Going – Or You Could Have a Really Bad Day
Opening Progress Monitoring Activity • Work in pairs • Take out two copies of the map of the united states • Decide who is number one and who is number two
Opening Progress Monitoring Activity – Round 2 • 1s close your eyes • 2s place an “X” somewhere on the map as a destination • 2s, place writing utensil in 1’s hand • Place the tip on Orange County • When I say begin, 1’s start your progress toward the destination #2 put an X on • Twos, you can provide no feedback, but only tell your partner when they get there. • BEGIN
Opening Progress Monitoring Activity – Round 2 • 2s close your eyes • 1s place an “X” somewhere on the map as a destination • 1s, place writing utensil in 2’s hand • Place the tip on Orange County • When I say begin, 2’s start your progress toward the destination #1 put an X on • One’s, you can provide “hot”/”cold” feedback, but only tell your partner when they get there. • BEGIN
Debrief • What was the difference in the experiences? • How do those differences translate into monitoring students progress or not? Why might progress monitoring be important?
30 years of research documents… • Progress monitoring produces accurate, meaningfulinformation about students’ academic levelsand their rates of improvement. • Progress monitoring is sensitive to student improvement.
30 years of research documents… • Progress monitoring corresponds well with high stakes tests. • When teachers use progress monitoring to inform theirinstructional decisions, students achievebetter.
Seven Step Process for Progress Monitoring • How to place students in CBM reading tasks for progress monitoring. • How to identify level of material for monitoring progress for oral reading fluency. • How to administer and score oral reading fluency. • How to graph scores. • How to set ambitious goals.
Seven Step Process for Progress Monitoring 6. How to apply decision rules to graphed scores to know when to make instructional changes and/or increase goals. 7. How to use oral reading fluency qualitatively to describe students strengths and weaknesses.
Step Two: How To Identify the Level of Material for Monitoring Progress • Typically, the students use the oral reading fluency passages prepared for their grade level. • However, some students may need to read from a different grade level if they are well below grade level expectations.
Step Two: Level of Material for Progress Monitoring • Determine grade level of student. • General objective is to select the level of passages where you expect the student to be performing proficiently at the end of a year (or after multiple months) • You want to be ambitious and realistic – this is the kind of goal that produces the best results • So basically, you want to find their instructional level, then select monitoring materials from a year ahead.
Not at Grade Level? Universal screening data does not always reflect accurate measurement of skills. In some cases, Universal Screening data show that grade-level passages are too frustrating for some students. What do we do to get a better understanding of a student’s current performance level?
Survey Level Assessment (SLA) • Process to determine Current Performance Levels when student is not working at grade level. • Can be used for RTI or IEP purposes. • Student is tested in successive levels, beginning with current grade placement, until he/she scores anywhere within the “Average range.” • Create SLA table, using Aggregate Norm Tables. Find score at or above the 25th%ile for the particular grade and time of year. • Scoring anywhere within the “Green” on AIMSweb Individual or Comparison reports.
Create Survey Level Assessment Table • Sally is a 4th grade student who was tested in the Fall. • Use AIMSweb Aggregate Growth Tables (next slide). *Using Survey Level Assessment, Sally’s performance is Average given a 3rd grade AIMSWEB R-CBM probe (Fall).
Third Quartile (50th- 74th %ile) Median or Middle Score First Quartile (0-24th%ile) Using AIMSweb Individual or Comparison Reports: Box Plots Fourth Quartile (75th – 100th%ile) ¼ of scores Above Average ¼ of scores Average Second Quartile (25th-49th %ile) ¼ of scores ¼ of scores Below Average
John5th grader:5th grade passage 26/12 John3rd grade passage62/4 John4th grade passage49/7 Conducting a Survey Level Assessment
Guidelines for administering SLA probes • Administer probes from successive grade-levels, beginning at the student’s current grade placement or one year above the student’s functioning level. • Reading-CBM: Use median score of 3 probes. • Rule of Thumb on R-CBM: If WRC is 20 or fewer, stop administering probes on this level and move one level below. • (For middle/high school students, suggested starting point is 6th grade passages. Survey levels higher or lower as needed).
Step Three: How To Administer and Score Oral Reading Fluency Probes • Students read passage for one minute. • Student reads out loud while teacher marks mistakes. • The number of words read correct and accuracy is calculated and graphed on student graph.
CBMOralReading Fluency (ORF) • For students in grades 1-6 • Student reads grade-appropriate passage for 1 minute from ORF Student copy • Teacher marks errors on ORF Teacher copy
ORF Student copy CBM Passage Reading Fluency (ORF)
ORF Teacher copy Numbers along margin allow for easy calculation of words attempted CBM Oral Reading Fluency (ORF)
CBM Oral Reading Fluency (ORF) • Scoring guidelines: • Repetitions, self-corrections, insertions, and dialectical differences are all scored as CORRECT • Mispronunciations, word substitutions, omitted words, hesitations (word not said within 3 seconds), and reversals are all scored as ERRORS
Additional scoring guidelines: A skipped line is counted as1 error Every word but 1 of the words is subtracted from the total number of words attempted CBM Oral Reading Fluency (ORF)
Reggie’s CBM ORF Words read incorrectly marked with a slash (/) Lines omitted marked with a horizontal line Last word read in 1 minute markedwith a slash CBM Oral Reading Fluency (ORF)
135 words attempted in 1 minute 14 of 15 wordsomitted in 4th line subtracted from 135 (135 – 14 = 121) 1 omission error and8 reading errors subtracted from 121 (121 – 9 = 112) Reggie’swrc= 112 Accuracy = 83% CBMOralReading Fluency (ORF)
Step 4: How to Graph CBM ORF Scores • Graphing student scores is vital • Graphs provide teachers with a straightforward way of • Reviewing a student’s progress • Monitoring the appropriateness of student goals • Judging the adequacy of student progress • Comparing and contrasting successful and unsuccessful instructional aspects of a student’s program
Step 4: How to Graph CBM ORF Scores • Teachers can use computer graphing programs • DIBELS website • Excel template • Teachers can create their own graphs • Create template for student graph • Use same template for every student in the classroom • Vertical axis has range of student scores • Horizontal axis has number of weeks
Student Improvement is Job #1 Goal Area Reading SouthIowa EastElementary Ruso District 01-02 Jacob Year School Teacher Name Goal Statement Expected Level of Performance #1 #2 #3 #4 Service Providers Parent Participation 120 110 100 90 80 70 60 Words correct per min. 50 40 30 20 10 0 M M M M M M M M M M M M M M M M M M M M M M M M M M M M M M M M M M Label Vertical Axis
Student Improvement is Job #1 Goal Area Reading SouthIowa EastElementary Ruso District 01-02 Jacob Year School Teacher Name Goal Statement Expected Level of Performance #1 #2 #3 #4 Service Providers Parent Participation 120 110 100 90 80 70 60 Words correct per min. 50 40 30 20 10 0 M M M M M M M M M M M M M M M M M M M M M M M M M M M M M M M M M M Day Label Horizontal Axis
Chart Baseline Goal Area Reading SouthIowa EastElementary Ruso District 05-06 Jacob Year School Teacher Name Goal Statement 120 110 100 90 80 Words/ min. 70 60 50 40 30 20 10 0 M M M M M M M M M M M M M M M M M M M M M M M M M M M M M M M M M M Day
Chart Baseline Goal Area Reading SouthIowa EastElementary Ruso District 05-06 Jacob Year School Teacher Name Goal Statement 120 110 100 90 80 Words/ min. 70 60 50 40 30 20 10 0 M M M M M M M M M M M M M M M M M M M M M M M M M M M M M M M M M M Day
Chart Baseline Goal Area Reading SouthIowa EastElementary Ruso District 05-06 Jacob Year School Teacher Name Goal Statement 120 110 100 90 80 Words/ min. 70 60 50 40 30 20 10 0 M M M M M M M M M M M M M M M M M M M M M M M M M M M M M M M M M M Day
Draw a Line to Separate Baseline Data Goal Area Reading SouthIowa EastElementary Ruso District 05-06 Jacob Year School Teacher Name Goal Statement 120 110 100 90 80 Words/ min. 70 60 50 40 30 20 10 0 M M M M M M M M M M M M M M M M M M M M M M M M M M M M M M M M M M Day
Label the Baseline Data Goal Area Reading SouthIowa EastElementary Ruso District 05-06 Jacob School Year Teacher Name Goal Statement 120 110 Baseline 100 90 80 Words/ min. 70 60 50 40 30 20 10 0 M M M M M M M M M M M M M M M M M M M M M M M M M M M M M M M M M M Day
Mark the Median Score Goal Area Reading SouthIowa EastElementary Ruso District 05-06 Jacob Year School Teacher Name Goal Statement 120 110 Baseline 100 90 80 Words/ min. 70 60 X 50 40 30 20 10 0 M M M M M M M M M M M M M M M M M M M M M M M M M M M M M M M M M M Day
Application Activity Determine which score is the median score • Use data from one of the grade levels you will be teaching
Oral reading fluency scores: 3rd: 83 wrc, 94% acc.; 87 wrc, 95% acc.; 89 wrc, 95% acc. 4th: 102 wrc, 98% acc.; 95 wrc, 98% acc.; 98 wrc, 98% acc. 5th: 110 wrc, 95% acc.; 102 wrc, 96% acc.; 103wrc, 96% acc. Application Activity-Reading
Step 4: How to GraphORFScores • Student scores are plotted on graph and a line is drawn between scores
Step 5: How to Set Ambitious Goals • Once a few scores have been graphed, the teacher decides on an end-of-year performance goal for each student • Three options for making performance goals: • End-of-Year Benchmarking • National Norms • Intra-Individual Framework
Step Five: How to Set Ambitious Goals Selection Criteria • Grade level benchmarks • Cut scores • Teacher expectation • Peer performance • Research standards • Use Convergent sources
End-of-Year Benchmarking For typically developing students, a table of benchmarks can be used to find CBM end-of-year performance goal Step 5: How to Set Ambitious Goals
Weekly growth rates for ORF (Words Read Correctly per Minute [WCPM] in 1 minute) From Fuchs, Fuchs, Hamlett, Walz, & Germann (1993)