Download
1 / 35
350 likes | 603 Views
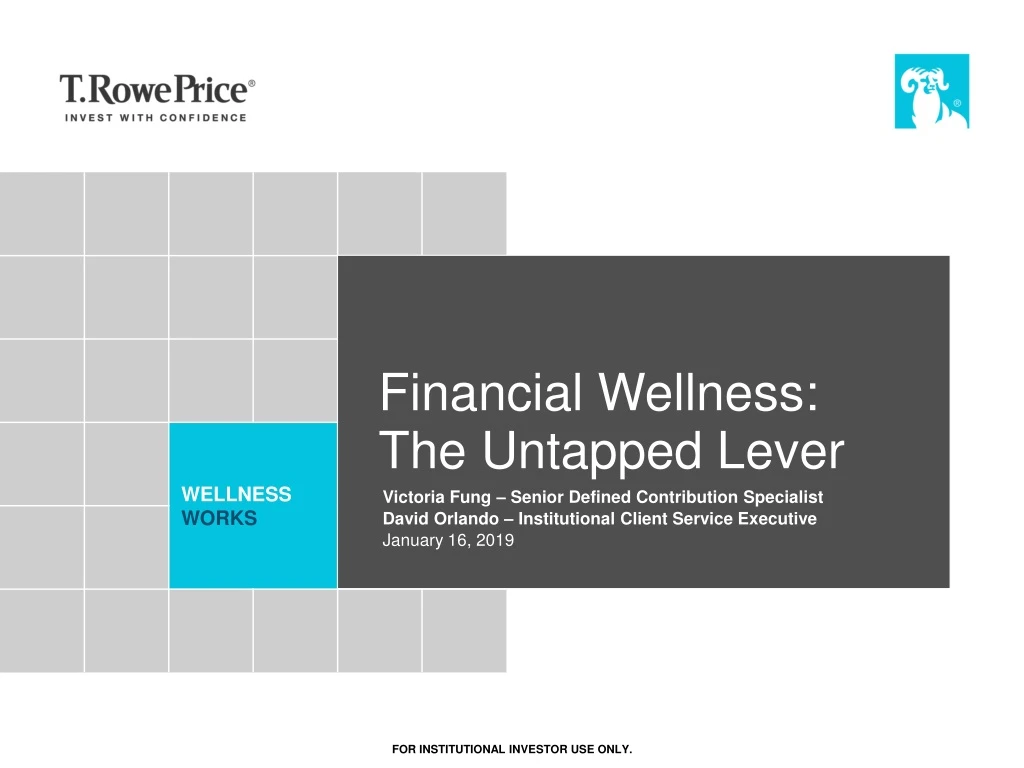
Financial Wellness: The Untapped Lever. Victoria Fung – Senior Defined Contribution Specialist David Orlando – Institutional Client Service Executive January 16, 2019. For Institutional Investor Use Only. Objectives. U.S. defined contribution market overview

E N D
Financial Wellness: The Untapped Lever Victoria Fung – Senior Defined Contribution Specialist David Orlando – Institutional Client Service Executive January 16, 2019 For Institutional Investor Use Only.
Objectives • U.S. defined contribution market overview • What is financial wellness? Why should plan sponsors care about it? • What tools and resources can help put financial wellness into action?
wellness works DEFINED CONTRIBUTION • 1As of September 30, 2018. • 2Firmwide AUM includes assets managed by T. Rowe Price Associates, Inc. and its investment advisory affiliates. • 3DC channel AUM is defined as T. Rowe Price institutionally managed assets under administration (AUA) as of September 30, 2018. Including retail defined contribution, defined contribution assets represent 51.8% of total firm AUM. • 4As of December 31, 2017 • 5Institutional DCIO AUM is defined as DC channel AUM minus T. Rowe Price institutionally managed AUA as of September 30, 2018. • 6Clients with plans on our OMNI recordkeeping platform as of December 31, 2017. Point of View T. Rowe Price Institutional Defined Contribution Mission • About Us • More than 80 years of investment management experience • Global firm headquartered in Baltimore, Maryland, with offices in 16 countries around the world • Employing over 6,900 associates worldwide1 • Managing $1,083.8B USD in assets1,2 • Launched asset allocation suite in 1990 • 595 investment professionals globally1 • Our DC Footprint • DC assets represent 43% of total firm assets under management (AUM)3 • Leveraging insights gained from more than 2 million Retirement Plan Services participants across more than 4,400 plans4 • 74% of our defined contribution assets are investment-only5 • 61% of our retirement plan clients have been with us 10 years or more6 • Deep DC plan design and policy expertise We are committed to the relentless pursuit of helping our clients evolve their retirement plans to empower participants to achieve retirement security and overall financial well-being. By harnessing expertise across the firm, we seek to deliver solutions to meet our clients’ goals and act with a broader commitment to advance the public discourse around retirement.”
U.S. Retirement MarketAssets wellness works Figures inUS$ HISTORICAL U.S. RETIREMENT MARKET ASSETS BY PLAN TYPE(US$B) CorporateDC CorporateDB IRA (IndividualRetirementAccount) NFP (Not-for-profit)/GovernmentalDC PublicDB $25,000 $20,000 $3,935 $3,576 $1,620 $15,000 $3,346 $3,357 $3,696 $1,412 $3,588 $3,149 $3,216 $982 $1,189 $6,819 $2,920 $1,109 $1,137 $10,000 $5,785 $994 $4,748 $4,207 $4,488 $3,425 $3,681 $2,866 $2,702 $5,000 $2,647 $2,468 $2,194 $2,254 $2,041 $4,599 $3,907 $3,403 $3,177 $3,058 $2,775 $2,580 $0 20052006200720082009201020112012201320142015 Across the various segments of the U.S. retirement market, none saw a year-over- year asset increase of better than 2% in 2015. The public defined benefit market was the only segment to exhibit negative asset growth in 2015, declining by 1.8% or approximately US$73billion. Source:CerulliAssociates, RetirementMarkets2016.Exhibit2.02,Historical RetirementMarketAssets bySegment,2005–2015. Most recent data available. 5
The shift from DB to DC plans continues; DC assets now represent 60% of total plan assets in theUS wellness works RETIREMENT PLANS OFFERED BY FORTUNE 500COMPANIES1 • 80% DC planonly • 14% Cash balance plan + DCplan • 5% Final average pay plan + DCplan • 1% Other hybrid plan + DCplan • 1% Career average pay plan + DCplan SPLIT BETWEEN DC/DB PLANASSETS2 DB DC 48% 2004 52% 40% 2015 60% 1Source: Willis Towers Watson’s analysis as of June 2015, Fortune 500. Total maynot be equal to 100% due to rounding. 2Source: Willis Towers Watson 2016 Global AssetSurvey. 6
U.S. DC Growing as the Source ofIncome wellness works SOURCES OF RETIREMENT INCOME BYGENERATION (MEAN%) Other assets DC plan (e.g., 401(k)) DBpension SocialSecurity 100% 90% 80% 70% 25% 26% 26% 36% 4% 60% 30% 42% 18% 47% 50% 9% 40% 30% 6% 6% 42% 20% 36% 26% 21% 10% 0% Millennial(Age18–33) Gen X(Age34–49) Baby Boomer(Age50–68) Retirees (Average Age63) Among retirees with DC assets, those assets contribute just 4% to their retirement income. However, millennials with a DC plan believe their DC assets will contribute almost half (47%) of their retirement income. Social Security will contributeless. Source:T. RowePrice RetireeandMillennialSavingsandSpendingStudy,2015.Note:Otherassets includeearningsfrom employment,income frompersonal savings and IRAs, inheritance, annuities, income from the sale of a primaryresidence. 7
U.S. Defined Contribution—AssetAllocation wellness works As of December 31,2016 ASSET ALLOCATION—ALLPLANS 2%2% 11% U.S.Equities TargetDate Self DirectedBrokerage FixedIncome 34% 7% CompanyStock MoneyMarket 5% Multi-AssetClass 1% OtherAssets* 38% U.S. definedcontribution plans have a higher allocation to U.S. equities and target datefunds. Source:T. RowePrice ReferencePointstudyof643U.S. corporatedefinedcontributionplans(401(k),457plans),asofDecember31,2016. *Other Assets include loan and settlement amounts. Numbers may not total 100% due torounding. Most recent data available.
Key OversightDecisions wellness works • Level ofemployer stewardship • Time, resources,and expertise • Selection and monitoring(process, documentation) • Use ofautomatic features • Design of employer contribution structure (stretch match,vesting, eligibility) • Post-terminationassets: stay in plan ordistribute • Lineup selection: simplicity orchoice • Investment belief: active/passive, number, type, incomesolutions • Risk focus: inflation, longevity, and/ormarket • Leverage scaleand buyingpower • Clear value forcost proposition • Scope ofeducational content • Access toadvice solutions • Range of communication channelssupported • Consideration ofholistic financialpicture • Access to multiple providers (recordkeeper, third party,etc.) These core DC plan management themes are inextricably linked and aremore easily assessed together when a plan philosophy and mission has beenestablished. Source: T. Rowe Price.
Observed Trends in U.S. DCPlans wellness works • 10–15 options but dynamics in bothdirections • Vehicles continue to evolve towards lower costs and greatercustomization • Increased institutionalpricing • Collective/commingled investmenttrusts • Separateaccounts • White labelproducts— fund offunds • ETFslimited 1T.RowePrice RetirementPlanServicesInc. OMNI401kand457plansfor whichTRP storesalleligibleparticipantinformation.Basedonanycontributiontype,as of 31 December 2016.
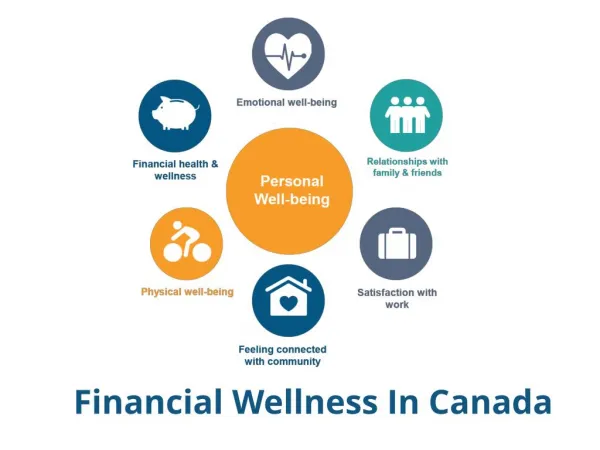
wellness works What is Financial Wellness? “ The ability of individuals to manage their daily finances while setting short- and long-term saving goals so that they can invest in a secure financial future. ”
The Financial Wellness Spectrum • Advanced • Trust and Estate • Income Planning • Intermediate • Long-term savings needs • Investing • Foundational • Debt management • Budgeting • Emergency preparedness
Historical objectives of retirement plans Increase Participation Increase Deferrals Asset Allocation
Innovations to plan design and investments have helped… Source: T. Rowe Price Retirement Plan Services, Inc., as of 31 December 17. Automatic Investment into a QDIA • 81% of participants remain in a default fund such as TDF
…but have not solved the problem completely 1 T. Rowe Price Retirement Saving and Spending Study (2015). 2 Career Builder 2017. 3 Report on the Economic Well-Being of U.S. Households in 2017, Federal Reserve Board. 4T. Rowe Price Retirement Saving and Spending Study 2017. DEBT IS ON THE RISE | Average household debt is up from $57,000 in 2015 to $72,000 in 2017.4 48% 78% 41% Can’t cover a $400 emergency3 Live paycheck to paycheck2 Can’t afford to save more1
There is opportunity to do more 1S&P Global FinLit Survey, 2015. 2U.S. Census Bureau, et al., 2014. 3American Psychological Association, 2015. 4MarketWatch, 2015. 5 U.S.A. Today, 2014. Of American adults… 24% 43% 64% 52% say they are financially illiterate1 of wages go to consumer debt payments2 say finances are the largest source of stress in their life3 Have less than $10,000 saved for retirement5
The opportunity for plan sponsors Sources: Aon Hewitt 2017 “Hot Topics in Retirement” Study; PSCA’s 59th Annual Survey of Profit Sharing and 401(k) Plans. 92% Although of sponsors said they were focusing on financial wellness in 2017 18% only have a program in place
wellness works FINANCIAL WELLNESS: THE UNTAPPED LEVER • The Focus on Financial Wellness • The increasing focus on financial wellness is driven by many factors. • 1Pulse survey conducted by P&I Content Solutions Group and statistical analysis conducted by Signet Research Inc. in early 2018. Survey population includes 289 corporate, nonprofit, and government plan sponsors with assets: 49% less than $500M, 15% between $500M and $1B, 32% between $1B and $15B, and 4% more than $15B. • Question: “As you consider the current market environment and some of the more common questions you receive from your plan participants/clients, what are the top three topics you would like to have more information about?” Impacts to Employees Impacts to Employers 25% Levels of financial stress Productivity and other costs Employees’ financial wellness influences… of plan sponsors named financial wellness as a top-ranked topic of interest1 Ability to save for retirement and meet competing priorities Value of retirement benefits to employer Ability to achieve retirement readiness Overall workforce management goals
Strain on work productivity 1Aon Hewitt. 2SHRM, 2014 “Financial Wellness in the Workplace Survey.” 70% of HR professionals surveyed say financial problems impact employee performance.1 44% of employers believe that offering additional guidance on handling finances will decrease the time employees spend at work tending to financial issues.2
High levels of financial stress for employees drive higher costs for their employers Higher EmployeeCost High Employee Stress 62% Americans who say they feel financially stressed at leastsome of thetime1 Over $5.6 million peryear2 1American Psychological Association Stress in America Survey (2017). 2Pension Consultants Inc. 2014, www.pension-consultants.com/the-impact-of-financial-stress-on-workforce-productivity.
Most employers want to help… In a recent study, 81% of plan sponsors said they wantto provide some type of financial wellness offering because “it’s the right thing todo.”1 Major Objectives of Financial WellnessInitiatives2 74% 67% 69% 64% Retaining skilledemployees Improvingemployee productivity Increasing employee satisfaction Competing effectively for skilledemployees 1Alight Solutions 2018 “Hot Topics in Retirement and Financial Wellbeing”Study. 2T.RowePrice/BrightworkPartners,LLC,PlanSponsorPulse Survey,April2016.Surveyof155401(k)plansponsorwithassetsof$100millionorconductedonline,March22–April1,2016.
Return on Investments for EmployeesLower Employee Stress Financial wellness programs can lead to lower employee stress, improved emotional outlook, and betterretirement preparedness. Lower EmployeeStress Improved EmotionalOutlook Initial Current Initial 18% 21% 22% 32% 7% 39% 35% Scared Confused Indifferent Confident Secure 28% 23% 20% Current 15% 15% 12% 15% 20% 40% 13% 9% 9% 7% Scared ConfusedIndifferent Confident Secure Overwhelming Stress HighStress SomeStress LowStress NoStress 42% of program participants contribute or plan to contribute 5% of theirsalary for retirement in the next twoyears Source: SmartDollar2018.
wellness works Do You Need Financial Wellness? Consider These Factors: Business symptoms of “unwellness” Retirement plan data Workforce profile and demographics Culture and benefits philosophy
Plan Data • Are employees retiring on time with adequate savings? • Are participants opting out of auto-enrollment and auto-increase? • Is there a high volume of plan-specific Web traffic or calls regarding loans, hardships, or access to money? • 96% • 66%
Workforce Profile and Participant demographics • Does the plan have a high proportion of young employees who may have significant debt? • Does the plan have young employees with a significant amount of college debt? • Does the plan have an aging population that may need assistance with such things as tax strategies and estate planning as they approach retirement?
Methods to Address Financial Wellness • Coaching and Behavioral Modification • Tools • Education and Literacy • Services and Products • Enhanced Employee Education Program
Considerations for Selecting a Provider Multimedia resources Budget or cost Data-reporting capabilities Business model Integration with other benefits Communication frequency
Financial Wellness: A Three-Part Framework Smart Dollar is an independent third parties and are not an affiliate or employee of T. Rowe Price.
Presenters Senior Defined Contribution Plan Specialist Victoria Fung Victoria Fung is a Senior Defined Contribution Plan Specialist with T. Rowe Price. She joined the firm in May 2017 and is responsible for coverage of large defined contribution (DC) plan sponsors across the western U.S. Prior to that, Ms. Fung served as a senior vice president in the institutional sales team at BlackRock in the U.S. and Canada defined contribution group. Over the last seven years, she had primary responsibility for sales and service to institutional participant-directed savings plans for corporations and governments. She was responsible for developing and growing relationships directly with plan sponsors to distribute a broad suite of investment solutions, including target date funds, active and passive equity and fixed income funds, and capital preservation strategies. In addition, she served as both a DC specialist for internal distribution partners and as an external advocate for plan design improvements to drive better retirement outcomes for participants. Ms. Fung was with BlackRock for nearly 10 years and was previously with Barclays Global Investors (BGI). At BGI, she was a client service operations specialist and responsible for liaising and distributing investment data to key DC stakeholders, including recordkeepers, consultants, custodians, and institutional clients. Prior to BGI, she was an account executive at Fisher Investments within the Private Client Group, where she was responsible for selling discretionary asset management services to high-net-worth individuals. Ms. Fung earned a B.A. in political science from the University of California-Berkeley. She is a Series 7 and 63 registered representative. Institutional Client Service Executive David Orlando Dave Orlando is an institutional client service executive for the Americas division of Global Investment Management Services (GIMS) of T. Rowe Price, the organization responsible for the firm's institutional business worldwide. He is a vice president of T. Rowe Price Group, Inc., and T. Rowe Price Associates, Inc. Mr. Orlando has 32 years of investment experience, 22 of which have been with T. Rowe Price. Previously, he was director of the western region relationship management team for T. Rowe Price Retirement Plan Services, the firm's defined contribution plan subsidiary. Prior to joining the firm in 1996, he was a consultant for Watson Wyatt Investment Consulting. Mr. Orlando has worked in the retirement plan industry since 1985. Mr. Orlando earned a B.A. in economics and psychology from Claremont McKenna College. He is a Series 7, 24 (principal), and 63 registered representative.
THank you. C1ET7YZEB201901-423583
What 401(k) Plan Sponsors Are FocusedOn wellness works Areas of IncreasedFocus Insights • 66% of plans with over US$100M have an investment committee focused on 401(k)plans.1 • Among those large plans with an investment committee, half can approve plan changes without furtherreview.1 • Majority of large plans with a defined benefit (DB) plan (72%) have investment professionals that manage both the DB investments and 401(k) investments.1 • Set plan mission, objectives, andbeliefs. • Balance governance with plancomplexity. • Emphasis on understanding value-for-feeproposition. • Leverage DOL/other regulatoryguidance. • Clarify processes anddocumentation. • Periodic review of the investment policystatement. Plan Governance • Off-the-shelf actively managed target date funds are the most common type of TD offered by large plans (59% of plans which offerTDFs).1 • Large plans offer an average of 20.7 investment options, while participants use an average of2.5.2 • 78% of plan sponsors prefer a core lineupwith • reasonable number offunds.3 • All large plans offer a core fixed income strategy, but few offer noninvestment-grade or global fixed incomestrategies.2 • Evaluate approach to target date funds (TDFs) relative to DOLtips. • Consolidate and simplify core menuconstruction. • Enhance and broaden opportunity set for some asset classes. • Introduce tailoredsolutions. • Adopt institutional investmentvehicles. • Leverage buying power andscale. Aim for Better InvestmentOutcomes • 64% of large plan sponsors feel somewhat/much better about employee retirement preparedness today compared to 2 yearsago.1 • 48% of large plans have a retirement preparedness metric and of these, the majority (52%) were provided by therecordkeeper.1 • Organizations with a DB plan are more likely to have a retirement preparedness metric than those plans without (58% vs.41%).1 • Increase focus on evaluating what constitutes success of plans. • Set specific plan goals around retirementpreparedness. • Adopt metrics to influence selection of QDIA, investment structure, and plan design focused on maximizingoutcomes. Retirement Readiness 1Source: T. Rowe Price Plan Sponsor Study/Human Resources Perspective, 2016. Survey of 269 401(k) plan sponsors with US$100M or more conducted by telephone or online, September 8–November 15,2016. 2Source: T. Rowe Price Reference Point study of 58 large plans over US$500M, as of December 31,2016. 3Source:T.RowePriceRetirementBenefitsPhilosophysurveybasedon211responsesthroughApril2017.
wellness works What 401(k) Plan Sponsors Are FocusedOn Areas of IncreasedFocus Insights • Large plan sponsors tend to take a more paternalistic view of employee retirement preparedness. • 99% indicate they have a duty (67% feel a great deal of responsibility/32% feel somewhat responsible) to help their 401(k) participants achieve retirement preparedness in order to have adequate income inretirement.1 • 36% of plan sponsors indicate they are targeting a particular population forimprovement.2 • Focus on member experience, engagement, andparticipation. • Gain insights into how well participants are preparedfor • retirement. • Relevant and timelycommunications. • Greater emphasis of DC as a “retirement plan” and/or “destinationaccount.” • Consider impact of differing participant needs and generational preferences. Participant Focus • 41% of large plan sponsors say helping retired employees manage the income from their 401(k) is a majorgoal.1 • Just 6.7% of large plans offer a retirement income guarantee product in the plan while another 18.2% are considering adding a retirement income product to theplan.3 • Top concerns with adding a retirement income guarantee product include fiduciary risk (56.9%), operational hurdles (52.9%) and cost(51%).3 • Consider whole retirement life cycle (wealth accumulation, transition to retirement, anddrawdown). • Heightened focus on helping participants draw downassets. • Increased time assessing spectrum of retirement income solutions relative to plan objectives andneed. • Early take-up rates low but increasinginterest. RetirementIncome Solutions • 70% of plan sponsors indicate leakage (e.g., defaults on loans, hardship withdrawals, cash- outs) is a major or minorproblem.1 • To address leakage, 58% of large plan sponsors with a leakage problem offer a financial wellness program (excluding individualized financial counseling) to help participants manage their day-to-day finances moresuccessfully.1 • 74% of plan sponsors view financial wellness programs as a retentiontool.4 • Beginning to integrate retirement planning into participants’ whole financialpicture. • Greater recognition that benefits are competing forsame • dollars/time and financial worries negatively impactproductivity. • Spectrum of approaches being introduced, including tools, financial literacy, andservices. Financial Wellness 1Source: T. Rowe Price Plan Sponsor Study/Human Resources Perspective, 2016. Survey of 269 401(k) plan sponsors with US$100M or more conducted by telephone or online, September 8–November 15,2016. 2Source: T. Rowe Price Retirement Benefits Philosophy survey based on 211 responses through April2017. 3Source: Plan Sponsor Council of America, PSCA’s 59th Annual Survey of Profit Sharing and 401(k) Plans,2015. 4Source:T.RowePrice PlanSponsorPulseSurvey,April2016.Surveyof155401(k)plansponsorswithUS$100Mormore conductedonline,March22–April1,2016. 33
IMPORTANT INFORMATION This material, including any statements, information, data and content contained within it and any materials, information, images, links, graphics or recording provided in conjunction with this material are being furnished by T. Rowe Price for general informational purposes only. Under no circumstances should the material, in whole or in part, be copied or redistributed without consent from T. Rowe Price. The material does not constitute advice of any nature, including fiduciary investment advice; it is not individualized to the needs of any specific benefit plan or retirement investor, nor is it intended to serve as the primary basis for investment decision-making. Prospective investors are recommended to seek independent legal, financial and tax advice before making any investment decision. The views contained herein are as of the date of publication and may have changed since that time. All investing is subject to risk, including the possible loss of the money you invest. T. ROWE PRICE, INVEST WITH CONFIDENCE and the Bighorn Sheep design are, collectively and/or apart, trademarks or registered trademarks of T. Rowe Price Group, Inc. in the United States, European Union, and other countries. This material is intended for use only in select countries. T. Rowe Price Investment Services, Inc.