Download
1 / 1
10 likes | 85 Views
Absolute protein quantification estimated by spectral counting using large datasets in PeptideAtlas

E N D
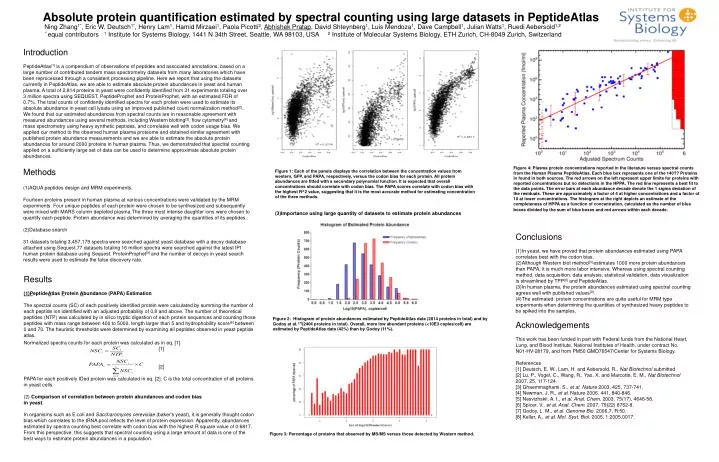
Absolute protein quantification estimated by spectral counting using large datasets in PeptideAtlas Ning Zhang1*, Eric W. Deutsch1*, Henry Lam1, Hamid Mirzaei1, Paola Picotti2, Abhishek Pratap, David Shteynberg1, Luis Mendoza1, Dave Campbell1, Julian Watts1, Ruedi Aebersold1,2 * equal contributors 1 Institute for Systems Biology, 1441 N 34th Street, Seattle, WA 98103, USA 2 Institute of Molecular Systems Biology, ETH Zurich, CH-8049 Zurich, Switzerland Introduction PeptideAtlas[1] is a compendium of observations of peptides and associated annotations, based on a large number of contributed tandem mass spectrometry datasets from many laboratories which have been reprocessed through a consistent processing pipeline. Here we report that using the datasets currently in PeptideAtlas, we are able to estimate absolute protein abundances in yeast and human plasma. A total of 2,814 proteins in yeast were confidently identified from 31 experiments totaling over 3 million spectra using SEQUEST, PeptideProphet and ProteinProphet, with an estimated FDR of 0.7%. The total counts of confidently identified spectra for each protein were used to estimate its absolute abundance in yeast cell lysate using an improved published count normalization method[2]. We found that our estimated abundances from spectral counts are in reasonable agreement with measured abundances using several methods, including Western blotting[3], flow cytometry[4] and mass spectrometry using heavy synthetic peptides, and correlates well with codon usage bias. We applied our method to the observed human plasma proteome and obtained similar agreement with published protein abundance measurements and we are able to estimate the absolute protein abundances for around 2000 proteins in human plasma. Thus, we demonstrated that spectral counting applied on a sufficiently large set of data can be used to determine approximate absolute protein abundances. Figure 4: Plasma protein concentrations reported in the literature versus spectral counts from the Human Plasma PeptideAtlas. Each blue box represents one of the 140?? Proteins in found in both sources. The red arrows on the left represent upper limits for proteins with reported concentrations but no detections in the HPPA. The red line represents a best fit to the data points. The error bars at each abundance decade denote the 1 sigma deviation of the residuals. These are approximately a factor of 4 at higher concentrations and a factor of 10 at lower concentrations. The histogram at the right depicts an estimate of the completeness of HPPA as a function of concentration, calculated as the number of blue boxes divided by the sum of blue boxes and red arrows within each decade. Methods (1)AQUA peptides design and MRM experiments. Fourteen proteins present in human plasma at various concentrations were validated by the MRM experiments. Four unique peptides of each protein were chosen to be synthesized and subsequently were mixed with MARS column depleted plasma.The three most intense daughter ions were chosen to quantify each peptide. Protein abundance was determined by averaging the quantities of its peptides. (2)Database search 31 datasets totaling 3,457,179 spectra were searched against yeast database with a decoy database attached using Sequest.77 datasets totaling 16 million spectra were searched against the latest IPI human protein database using Sequest. ProteinProphet[5] and the number of decoys in yeast search results were used to estimate the false discovery rate. Figure 1: Each of the panels displays the correlation between the concentration values from western, GFP, and PAPA, respectively, versus the codon bias for each protein. All protein abundances are fitted with a secondary polynomial function. It is expected that overall concentrations should correlate with codon bias. The PAPA scores correlate with codon bias with the highest R^2 value, suggesting that it is the most accurate method for estimating concentration of the three methods. (3)Importance using large quantity of datasets to estimate protein abundances • Conclusions • In yeast, we have proved that protein abundances estimated using PAPA • correlates best with the codon bias. • (2)Although Western blot method[3] estimates 1000 more protein abundances • than PAPA, it is much more labor intensive. Whereas using spectral counting • method, data acquisition, data analysis, statistical validation, data visualization • is streamlined by TPP[8] and PeptideAtlas. • (3)In human plasma, the protein abundances estimated using spectral counting • agrees well with published values[9]. • (4)The estimated protein concentrations are quite useful for MRM type • experiments when determining the quantities of synthesized heavy peptides to • be spiked into the samples. • Acknowledgements • This work has been funded in part with Federal funds from the National Heart, • Lung, and Blood Institute, National Institutes of Health, under contract No. • N01-HV-28179, and from PM50 GMO76547/Center for Systems Biology. • References • [1] Deutsch, E. W., Lam, H. and Aebersold, R., Nat Biotechnol submitted • [2] Lu, P., Vogel, C., Wang, R., Yao, X. and Marcotte, E. M., Nat Biotechnol • 2007, 25, 117-124. • [3] Ghaemmaghami, S., et al. Nature 2003, 425, 737-741. • [4] Newman, J. R., et al. Nature 2006, 441, 840-846. • [5] Nesvizhskii, A. I., et al. Anal. Chem. 2003, 75(17), 4646-58. • [6] Spicer, V., et al. Anal. Chem. 2007, 79(22) 8762-8. • [7] Godoy, L. M., et al. Genome Bio. 2006,7, R:50. • [8] Keller, A., et al. Mol. Syst. Biol. 2005, 1:2005.0017. Results (1)PeptideAtlas Protein Abundance (PAPA) Estimation The spectral counts (SC) of each positively identified protein were calculated by summing the number of each peptide ion identified with an adjusted probability of 0.8 and above. The number of theoretical peptides (NTP) was calculated by in silico tryptic digestion of each protein sequences and counting those peptides with mass range between 400 to 5000, length larger than 5 and hydrophobility score[6] between 0 and 70. The heuristic thresholds were determined by examining all peptides observed in yeast peptide atlas. Figure 2: Histogram of protein abundances estimated by PeptideAtlas data (2814 proteins in total) and by Godoy et al. [7](2404 proteins in total). Overall, more low abundant proteins (<10E3 copies/cell) are estimated by PeptideAtlas data (42%) than by Godoy (11%). Normalized spectra counts for each protein was calculated as in eq. [1]. [1] [2] PAPA for each positively IDed protein was calculated in eq. [2]. C is the total concentration of all proteins in yeast cells. (2) Comparison of correlation between protein abundances and codon bias in yeast. In organisms such as E.coli and Saccharomyces cerevisiae (baker's yeast), it is generally thought codon bias which correlates to the tRNA pool reflects the level of protein expression. Apparently, abundances estimated by spectra counting best correlate with codon bias with the highest R square value of 0.6817. From this perspective, this suggests that spectral counting using a large amount of data is one of the best ways to estimate protein abundances in a population. Figure 3: Percentage of proteins that observed by MS/MS versus those detected by Western method.