Download
1 / 22
230 likes | 413 Views
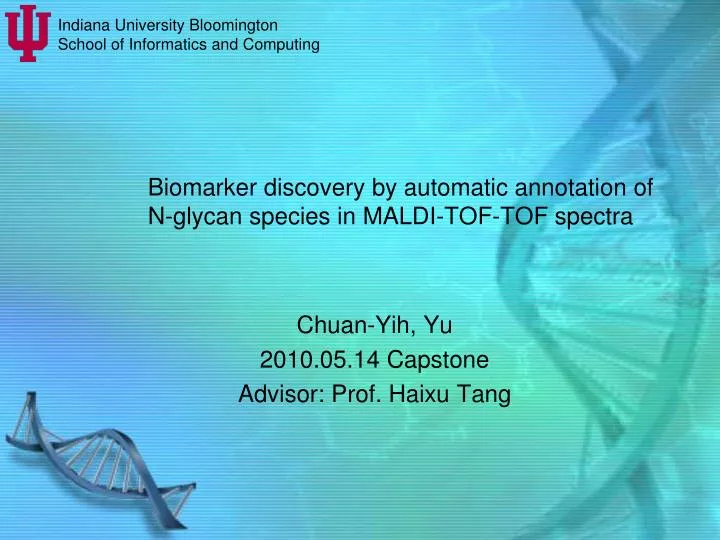
Indiana University Bloomington School of Informatics and Computing . Biomarker discovery by automatic annotation of N-glycan species in MALDI-TOF-TOF spectra. Chuan- Yih , Yu 2010.05.14 Capstone Advisor: Prof. Haixu Tang . Outline. Introduction

E N D
Indiana University Bloomington School of Informatics and Computing Biomarker discovery by automatic annotation of N-glycan species in MALDI-TOF-TOF spectra Chuan-Yih, Yu 2010.05.14 Capstone Advisor: Prof. Haixu Tang
Outline • Introduction • Glycoprotein, Monosaccharides, Mass Spectrometry • Problem set • Goals • MultiNGlycan • Result • Future works
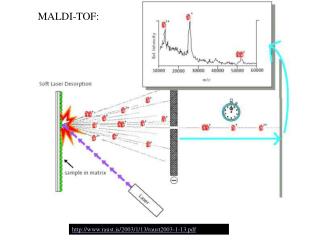
Introduction http://www.fruitfly.org/ 1.Apweiler, R., H. Hermjakob, and N. Sharon, On the frequency of protein glycosylation, as deduced from analysis of the SWISS-PROT database.BiochimBiophysActa, 1999. 1473(1): p. 4-8 • Post-Translation Modification (PTM) • Nitrosylation • Phosphorylation • Glycosolation • 50% of all eukaryotic proteins are glycosylated1
Glycoprotein • Protein glycosylation • N-linked glycosylation • Core structure – 2 GlcNac + 3 Man • Asn-X-Ser or Asn-X-Thr, X can be any but Pro • Glycosylation before folding • O-linked glycosylation • Core structures • Serine or Threonine • Glycosylation after folding DalitShental-Bechor and Yaakov Levy, Effect of glycosylation on protein folding: A close look at thermodynamic stabilization, PNAS June 11, 2008
Monosaccharides • Building blocks • Diverse linage • Three types N-linked glycan • High mannose • Complex • Hybrid Graphs: Varki, A., Essentials of glycobiology. 2nd ed. 2009, Cold Spring Harbor, N.Y.: Cold Spring Harbor Laboratory Press. xxix, 784 p
Mass Spectrometry • Wright scale of molecular • Ion Source • Electrospray ionization (ESI) • Matrix-assisted laser desorption/ionization (MALDI) • Mass Analyzer • Time of flight (TOF) • Quadrupole • Fourier transform mass spectrometry (FTMS) • Detector • Charge induced or the current produced
MALDI-TOF-TOF Graph:MALDI-TOF Mass Analysis. (2008, 11 16). Retrieved May 2, 2009, from The Protein Facility of the Iowa State University Office of Biotechnology www.protein.iastate.edu/maldi.html
Problem Set http://en.wikipedia.org/wiki/Carbon • Isotope pattern overlap • Permethylated, Add Sodium • 2 GlcNac + 9 Man = 2,396.18 • 7 GlcNac + 3 Man = 2,397.22 • High-throughput glycans screening • Find significant differences between groups of sample Graphs: Isotope Pattern Calculator v4.0 http://yanjunhua.tripod.com/pattern.htm
Goals • Glycans profile correlation • Report scores for non-overlap and overlap profile • Glycans examination • Glycan profiling comparison • Report significant glycan between groups • Glycans biomarker discovery
Glycans Profile Correlation 1.Krambeck, F.J. and M.J. Betenbaugh, A mathematical model of N-linked glycosylation.BiotechnolBioeng, 2005. 92(6): p. 711-28. 2.Rockwood, A., S. Van Orden, and R. Smith, Rapid Calculation of Isotope Distributions. Analytical Chemistry, 1995. 67: p. 2699-2704. • For each glycan combination • 412 different glycan combinations1 • Generate a theoretical isotope pattern • Calculate the correlation for following cases • Glycans • Glycans + Glycans, linear combination applied • Glycans + Unknown, linear combination applied • Mercury algorithm2
Three Cases Glycans Experiment spectrum Glycans α β Unknown Score α β
Glycan Profiling Comparison HCC: Hepatocellular Carcinoma ( Cancer of liver) CLD: Chronic liver disease Graph: Ressom, H.W., et al., Analysis of MALDI-TOF mass spectrometry data for discovery of peptide and glycan biomarkers of hepatocellular carcinoma. J Proteome Res, 2008. 7(2): p. 603-10. • Multiple spectra comparison • Biomarker discovery • Given spectrum with several conditions • Find distinct glycans between samples
Concept Remove the least significant component. Repeat until all the score above threshold. 70% identical with a cutoff at 0.5 Health spectra (H1, H2, H3…Hk) Disease spectra (D1, D2, D3…Dk) 1.Hastie, T., et al., 'Gene shaving' as a method for identifying distinct sets of genes with similar expression patterns. Genome Biol, 2000. 1(2): p. RESEARCH0003
Multi N-Glycan 1.Pedrioli, P., et al., A Common Open Representation of Mass Spectrometry Data and its Application in a Proteomics Research Environment. Nature Biotechnology, 2004. 22(11): p. 1459-1466. • Software Requirement • .net framework 2.0 using C# • C++ runtime • R • Thermo Scientific Xcalibur • Input • Spectrum • Plain text (Peak list) • mzXML1 • RAW ( instrument raw file) • Glycans list • CSV file
Software Interface Biomarker discovery setting Html result export
Result Can’t find the glycan structure in CFG database Filtered out
Future Works Test on more clinical samples Verify the correlation between glycan modification with disease Perform these tasks on O-linked glycan Apply de novo glycan sequencing
References Apweiler, R., H. Hermjakob, and N. Sharon, On the frequency of protein glycosylation, as deduced from analysis of the SWISS-PROT database.BiochimBiophysActa, 1999. 1473(1): p. 4-8. DalitShental-Bechor and Yaakov Levy, Effect of glycosylation on protein folding: A close look at thermodynamic stabilization, PNAS June 11, 2008 Hastie, T., et al., ‘Gene shaving’ as a method for identifying distinct sets of genes with similar expression patterns. Genome Biol, 2000. 1(2): p. RESEARCH0003. Krambeck, F.J. and M.J. Betenbaugh, A mathematical model of N-linked glycosylation.BiotechnolBioeng, 2005. 92(6): p. 711-28. Pedrioli, P., et al., A Common Open Representation of Mass Spectrometry Data and its Application in a Proteomics Research Environment. Nature Biotechnology, 2004. 22(11): p. 1459-1466. Ressom, H.W., et al., Analysis of MALDI-TOF mass spectrometry data for discovery of peptide and glycan biomarkers of hepatocellular carcinoma. J Proteome Res, 2008. 7(2): p. 603-10. Rockwood, A., S. Van Orden, and R. Smith, Rapid Calculation of Isotope Distributions. Analytical Chemistry, 1995. 67: p. 2699-2704. Tang, Z., et al., Identification of N-glycan serum markers associated with hepatocellular carcinoma from mass spectrometry data. J Proteome Res, 2010. 9(1): p. 104-12. Varki, A., Essentials of glycobiology. 2nd ed. 2009, Cold Spring Harbor, N.Y.: Cold Spring Harbor Laboratory Press. xxix, 784 p.
Acknowledge Advisor: Prof. Haixu Tang Co-worker: AnoopMayampurath Collaborator: YehiaMechref, Department of Chemistry This work will present in 26th May, 58th ASMS Conference Salt Lake City, Utah and submit to the Bioinformatics Application Notes.