Download

1 / 20
200 likes | 565 Views
Applying Population Ecology: The Human Population. G. Tyler Miller’s Living in the Environment Chapter 6. Key Concepts. Factors affecting human population size. Human population problems. Managing population growth. CASE STUDY: Thailand. 1971 Policy to reduce population

E N D
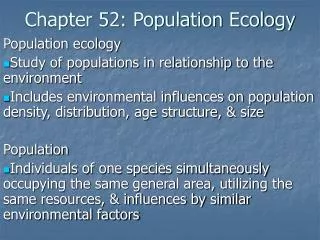
Applying Population Ecology: The Human Population G. Tyler Miller’s Living in the Environment Chapter6
Key Concepts • Factors affecting human population size • Human population problems • Managing population growth
CASE STUDY: Thailand 1971 Policy to reduce population - Before: 3.2% GR, avg. family: 6.4 children - After (1986): 1.6% GR, avg. family: 1.7 children Programs initiated Government supported family planning High literacy rate among women Increased economic role & advances for women’s rights Better health care for women & children Population and Community Development Association (PCDA) Non profit organization Helped government by supporting programs Handed out contraceptives at festivals, movies, traffic jams Developed ads & witty songs
Factors Affecting Human Population Size Population Change = (Births + Immigration) – (Deaths + Emigration) • Population change equation • Crude birth rate (CBR) - # live births per 1000 people in a population in a given year • Crude death rate (CDR) - - # live deaths per 1000 people in a population in a given year Refer to Figure 10-3, p. 177
Describing Population Changes Doubling Times - time (years) for a pop. Growing at a specified rate to double in size “Rule of 70” - - EX: 2004 world’s pop. growth rate 1.2% doubling time = 70/1.2= 56 years
GLOBAL FERTILITY Fertility - # of births that occur to an individual woman or in an pop. Replacement-level Fertility - # of children a couple must bear to replace themselves Total Fertility Rate (TFR) - average # of children a woman may typically have during her reproductive years
UPS & DOWNS: US Fertility & Birth Rates 76 mil (1900) to 294 mil (2004) BIRTH RATES IN THE US 32 30 28 26 24 22 20 18 End of World War II 16 Demographic transition Depression Baby boom Baby bust Echo baby boom 14 0 2010 1910 1920 1930 1940 1950 1960 1970 1980 1990 2000 Year
Factors Affecting Birth Rates and Total Fertility Rates • Children in Labor Force • Cost of raising and educating children • Availability of pension systems • Urbanization • Education and employment for women • Infant mortality rate • Average marrying age • Abortion • Availability of birth control
Factors Affecting Death Rates • Life expectancy - avg. # years a newborn infant can expect to live • Infant mortality rate (IMR) - # babies out of every 1000 born who die before their 1st birthday
Immigration in the US Countries encourage: Canada, Australia, US Account for 1% for growth rate in developed countries Accounts for 41% of country’s annual growth rate 1820-1960 most were from Europe Since 1960 most are from Latin America (51%), Asia (30%), Europe (13%) Largest minority group are Latinos Concern: illegal immigration
Population Age Structure Male Female Rapid Growth Guatemala Nigeria Saudi Arabia Slow Growth United States Australia Canada Zero Growth Spain Austria Greece Negative Growth Germany Bulgaria Sweden Ages 0-14 Ages 15-44 Ages 45-85+ Fig. 10-14 p. 184
Solutions: Influencing Population Size • Migration • Environmental refugees • Reducing births • Family planning • Empowerment of women • Economic rewards and penalties
The Demographic Transition Stage 1 Preindustrial Stage 2 Transindustrial Stage 3 Industrial Stage 4 Postindustrial High 80 70 60 Birth rate 50 Birth rate and death rate (number per 1,000 per year) Relative population size 40 30 Death rate 20 10 Total population Low 0 Low growth rate Increasing Growth growth rate Very high growth rate Decreasing growth rate Low growth rate Zero growth rate Negative growth rate Time Fig. 10-20 p. 189
Case Study: Slowing Population Growth in India Generally disappointing results: • Poor planning • Bureaucratic inefficiency • Low status of women • Extreme poverty • Lack of support
Case Study: Slowing Population Growth in China • Economic incentives • Free medical care • Preferential treatment • Locally administered • Very intrusive and coercive
Cutting Global Population Growth • Family planning • Improve health care • Elevate the status of women • Increase education • Involve men in parenting • Reduce poverty • Sustainability