Download
1 / 17
180 likes | 271 Views
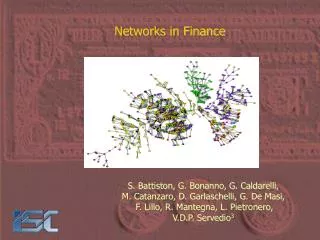
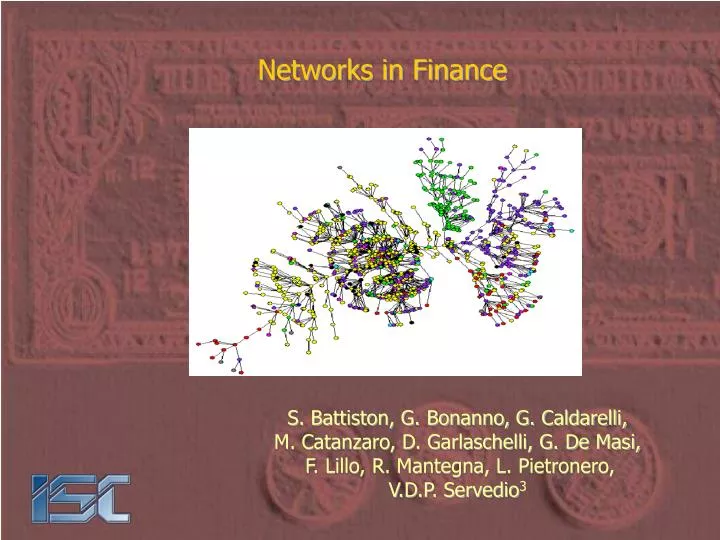
Networks in Finance. S. Battiston, G. Bonanno, G. Caldarelli, M. Catanzaro, D. Garlaschelli, G. De Masi, F. Lillo, R. Mantegna, L. Pietronero, V.D.P. Servedio 3. NETWORKS IN FINANCE AND ECONOMICS - Rome Jan 20 th 2006. Summary. WHICH NETWORKS ?

E N D
Networks in Finance S. Battiston, G. Bonanno, G. Caldarelli, M. Catanzaro, D. Garlaschelli, G. De Masi, F. Lillo, R. Mantegna, L. Pietronero, V.D.P. Servedio3
NETWORKS IN FINANCE AND ECONOMICS - Rome Jan 20th 2006 Summary • WHICH NETWORKS ? The cases of study where graph theory has been applied Stock correlations Stock ownerships Trade between countries Board of Directors Inter-bank Market NOT Network in economics (firm networks (Marro), Production networks (Weisbuch) etc. ). • WHAT IN NETWORKS ? Degree distribution Community Structure Robustness • WHY NETWORKS ? Do we learn something? NETWORKS IN FINANCE AND ECONOMICS - Rome Jan 20th 2006
NETWORKS IN FINANCE AND ECONOMICS - Rome Jan 20th 2006 Stock Correlations Logarithmic return of stock i Correlation between returns (averaged on trading days) Distance between stocks i, j
NETWORKS IN FINANCE AND ECONOMICS - Rome Jan 20th 2006 Spanning Trees,Bonanno et al. Physical Review E 68 046130 (2003). Correlation based minimal spanning trees of real data from daily stock returns of 1071 stocks for the 12-year period 1987-1998 (3030 trading days). The node colour is based on Standard Industrial Classification system. The correspondence is: red for miningcyan for constructionyellow for manufacturinggreen for transportation,, light blue for public electric,gas and sanitaryservices administrationmagenta for wholesale trade black for retail trade purple for finance and insurance orange for service industries
NETWORKS IN FINANCE AND ECONOMICS - Rome Jan 20th 2006 Graph from Threshold,Onnela et al. Eur. Phys. J. B 38, 353–362 (2004).
NETWORKS IN FINANCE AND ECONOMICS - Rome Jan 20th 2006 Planar Maximally Filtered Graph,Tumminello et al. PNAS 102, 10421 (2005).
NETWORKS IN FINANCE AND ECONOMICS - Rome Jan 20th 2006 Stock Ownership Garlaschelli et al. Physica A, 350 491 (2005).
NETWORKS IN FINANCE AND ECONOMICS - Rome Jan 20th 2006 The degree distribution is fat-tailed
NETWORKS IN FINANCE AND ECONOMICS - Rome Jan 20th 2006 Can we reproduce the observed heterogeneity by means of a simple network model? Each investor/asset has a ‘fitness’ (wealth/performance) drawn from a probability distribution r(x) Edges are drawn with probability f(xi,xj) G.C, A. Capocci, P. De Los Rios, M.A. Munoz PRL89, 258702 (2002).
NETWORKS IN FINANCE AND ECONOMICS - Rome Jan 20th 2006 Stock Ownership Various, see Ref in Battiston et al. EPJB, 350 491 (2005). multiple Interlock • Bipartite Graph: • two different kind of graphs • edges between different groups. Projection Link vertices of the same group Consider Weight ! Peso
NETWORKS IN FINANCE AND ECONOMICS - Rome Jan 20th 2006 Inter-Bank Loans De Masi et al. In preparation. Banks exchange money overnightly, in order to meet the customer needs of liquidity as well as ECB requirements
NETWORKS IN FINANCE AND ECONOMICS - Rome Jan 20th 2006 Actually the banks form different groups roughly related to their “size” when considering the average volume of money exchanged.
NETWORKS IN FINANCE AND ECONOMICS - Rome Jan 20th 2006 World Trade Web Boguña et al. PRE, 68 151011 (2003). The system is composed by 179 countries connected by trade channels exchanged in the year 2000.
NETWORKS IN FINANCE AND ECONOMICS - Rome Jan 20th 2006 Fitness for WTW Garlaschelli et al. PRL 93 188701 (2004). The fitness is given by the normalized Gross Domestic Product of the country.
NETWORKS IN FINANCE AND ECONOMICS - Rome Jan 20th 2006 Conclusions • Financial Networks can help • In distinguishing behaviour of different markets • In visualizing important features as the chain of control • In testing the validity of market models • They might be an example of scale-free networks even more general than those described by growth and preferential attachment.
NETWORKS IN FINANCE AND ECONOMICS - Rome Jan 20th 2006 My View = + Random Graphs defined on Pareto distributed vertices Naturally form scale-free networks. (Scale-free networks arise also from Gaussian in specific case)