Download
1 / 40
410 likes | 529 Views
STAR TPC Cluster and Hit Finder Software. Raimond Snellings. Outline. Structure cluster finder module Structure tracking module Tracking evaluation Results physics analysis. Data Flow. St_tcl_Maker. Sector Layout. TPC Layout. Sectors: 24 Inner and Outer sectors

E N D
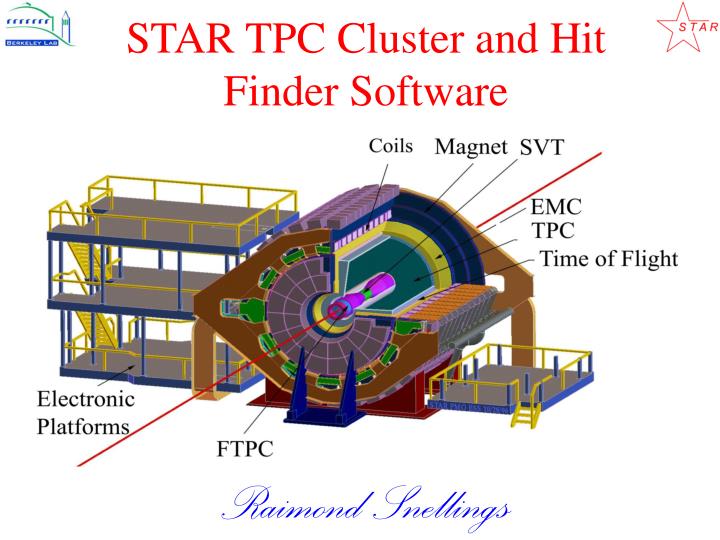
STAR TPC Cluster and Hit Finder Software Raimond Snellings
Outline • Structure cluster finder module • Structure tracking module • Tracking evaluation • Results physics analysis
TPC Layout Sectors: 24 Inner and Outer sectors Inner pads: 13 rows, 2.85x11.5 mm Outer pads: 32 rows, 6.2x19.5 mm Clock Freq: 9.4 MHz Time buckets: +/- 400 used TPC Gas: P10 Drift Velocity: 5.4 cm/msec
Deconvolute Clusters Mountain Finder Fit isolated cluster: Three point Gaussian or Weighted mean in pad direction Weighted mean in time direction
Cluster Shape Number of time buckets approximately 4-5 Number of pads approximately 4-5
To Do • Test algorithms / parameters using TRS and real data • Test performance, test cpu usage, see star note SN0238
STAR TPC Tracking Software Iwona Sakrejda 8 April 2000 STAR & ALICE Joint Software Meeting
Structure of the tpt Module Pass 1 Pass 2 All the elements switchable Set up subdivision into sub volumes overlapping in z Set up subdivision into sub volumes overlapping in z Form segments with mapping Form segments with mapping Remove used hits Form segments with linear extrapolation Form segments with linear extrapolation Extend segments Extend segments Merge spirals Merge spirals
Sub Divisions Set up subdivision into sub volumes overlapping in z z Prediction always far from edges of a sub volume. Within a padrow of a sector hits are sorted in z, each hit points to the next one. There is a smooth transition across the central membrane.
Root Formation • A free point is identified, it becomes a seed. • In the outer sector hits are connected if clusters they belong to overlap in pad and time-bucket space. There is no assumption about the position of the primary vertex. • In the inner sector there is a separation between padrows, so the connectivity cannot be used. • A prediction is made based on the assumption that the track originated at (0,0,0). • All the hits within tolerance around this prediction are considered candidates. • From two hits a linear prediction is formed (0,0,0 assumption dropped) and for each pair, the best candidate is accepted.
Bias in Root Formation Z, Inner Sector Vertex shift [cm] Bias [cm] Radius [cm]
Segment Formation With Conformal Mapping • Track seed formation (so called roots), if requirements are fulfilled a handful of 3pt roots can start from 1 point. • Roots are created in the x,y,z space • All roots are extended and the best segment is kept (this part only within 1 sector). • Based on track parameters a prediction for the next row is calculated and the best match is accepted. • The mapping is used only to update the track parameters. • Tolerances are expressed in terms of cluster width. • Gaps are limited. • Every time a hit is added, track parameters are updated. • At the end the assumption about the vertex in x-y is dropped and track is re-fit as a circle+line.
Form Segments Using Linear Extrapolation • Track seed formation (so called roots), if requirements are fulfilled a handful of 3pt roots can start from 1 point. • Roots are created in the x,y,z space (as before) • All roots are extended and the best segment is kept (this part only within 1 sector). • Based on track parameters a prediction for the next row is calculated and the best match is accepted. • Use linear extrapolation while extending track • If a new point is added the earliest one is dropped. • Tolerances are expressed in terms of cluster width. • Gaps are limited. • Every time a hit is added, track parameters are updated. • At the end the track is re-fit as a circle+line.
Extend Segments • All the hits from the current pass are released • All the segments from the current pass are sorted from the longest to the shortest • If a segment has 45 hits, it’s just re-established • A segment is extended within the sector where it was found and in the two neighboring sectors (if predictions lead us there) • Results of the helix fit are used for predictions • If points are added, the track is re-fit and the “losers” are updated - a stronger track can absorb a poor one • Track that lost its hits is flagged as negative
Track Fitting • Fast 2-component helix fit based on algorithm by Chernov and Oskov • Circle fit in the x-y plane • Line fit in the s-z coordinates where s is the track length along the circle • Later on the track is re-fit with a proper covariance matrix (Kalman fitting)
Methods of Tracking Evaluation • Analysis of cosmic and test data (residuals and momentum distributions) • Visual inspection of reconstructed events (DSV - Duncan Prindle, university of Washington) • Evaluation histograms in root4star • Matching tables • tte_mctrk - one entry per Monte Carlo track • tte_eval - one entry per reconstructed track • Global reconstruction (vertex, primary tracks) • Physics analysis • Timing
TPC Reconstruction: Test Runs Summer 99’ ~100K events December 99’ ~100K events February/March 2000 ~1M events During the 3 running periods cosmic and laser events were taken with all the magnetic field configurations (full, half, no field). Tested not only the detector, but also the reconstruction chain, calibrations and the Data Base software. Provided information for testing the trigger, RICH, SVT
Cosmic Ray in TPC and STAR Trigger Detectors H.J. Crawford - STAR Trigger
TPC Reconstruction - Lasers • Laser events were used to • verify the clock frequency • calculate the drift velocity • measure the trigger offset There are ~500 laser beams in the chamber and a radial pattern on the central memebrane
TPC Reconstruction – Momentum Resolution Differences between the test results and the Conceptual Design Report (CDR) understood - specifications will be met during Heavy Ion runs F. Wang 03/30/2000
TPC Reconstruction - Position Resolution Crossing angle track padrow TPC Sector TPC position resolution meets CDR specifications R. Snellings 03/30/2000
TPC Reconstruction - de/dx Resolution Expected value for full length tracks 6.8% F. Wang 03/30/2000
TPC Reconstruction - Test Runs Beam gas events were reconstructed on the day they were taken.
Available Visualizations Macros from Raimond TPC tables DST GSTAR TPC reconstruction DST CAI SN325 DAQ CAI TPC Pad Monitor
90% all lost Pt[GeV]
Efficiency As a Function of h Efficiency degrades with multiplicity. For Venus generator it averages at ~90% for central events All primary Lost primary
Track Reconstruction Efficiency 100% 90% cm Track reconstruction efficiency at midrapidity as a function of the position of Au + Au collision Q.Li 03/30/2000
Momentum Resolution (simulated momentum - reconstructed momentum)/(simulated momentum) protons kaons pions
Vertex Resolution (Input vertex - reconstructed vertex)
400 tracks/event tpt Maker - 0.9s tpt module - 0.5s 4000 tracks/event tpt Maker - 12s tpt module - 8s 15 % of total CPU for A chain with TPC only Timing on Rcas6017 RHIC BNL Computing Farm TPC Only This numbers were obtained before we switched from the FORTRAN based geometry routines to C++ StDbUtilities. Now Herb Ward is doing the timing.
Results of the Test Run Analysis and Simulations Show Our Readiness to Analyze Data in Summer of 2000.
Azimuthal Angle pions With Respect to the Reaction Plane 60 events 1 minute of data taking Full reconstruction chain used Put in 10% found 8.9%