Download
1 / 27
410 likes | 1.22k Views
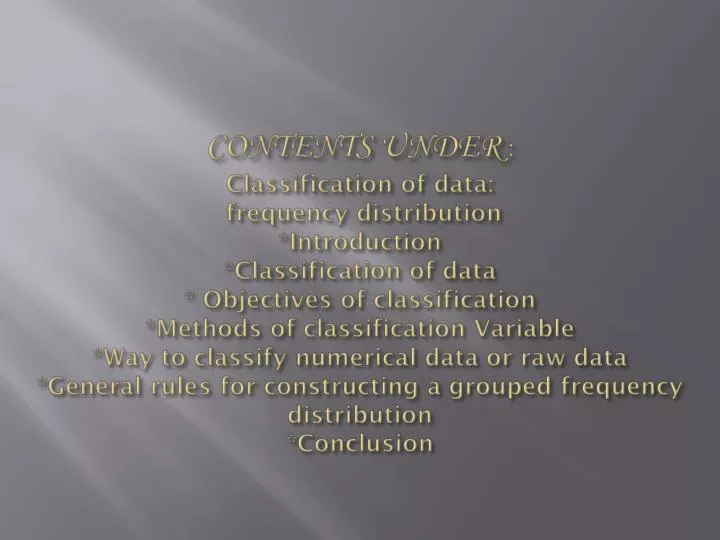
CONTENTS UNDER : Classification of data : frequency distribution *Introduction *Classification of data * Objectives of classification *Methods of classification Variable *Way to classify numerical data or raw data *General rules for constructing a grouped frequency distribution *Conclusion.

E N D
CONTENTS UNDER : Classification of data:frequency distribution*Introduction*Classification of data* Objectives of classification*Methods of classificationVariable*Way to classify numerical data or raw data*General rules for constructing a grouped frequency distribution*Conclusion
Introduction After the data have been collected, the next step is to present the data in some orderly and logical form so that their essential features may become explicit. The need for proper presentation of data arises because the mass of collected data in their raw form is often so volumes, unintelligible and uninteresting that it starts at the face of the reader.
Classification of Data Classification is the process of arranging the data into different groups or classes according to some common characteristics. “Classification is the process of arranging things in groups according to their resemblances and affinities”. -CONNOR “Classification is the grouping of related facts into classes” -SPURR AND SMITH
Objectives of Classification *To condense the mass of data in such a way that their similarities and dissimilarities become very clear. *To facilitate comparisons, i.e., to make the data comparable. *To point out the most important features of the data at a glance. *To present the data in a brief form. *To make data attractive and effective.
Methods of Classification Classification Geographical Chronological Qualitative Quantitative
1.Geographical Classification In geographical classification, data are classified on the basis of geographical or locational differences between the various items. For example:- No. of firms producing bicycles in 2001
2.Chronological Classification When the data are classified on the basis of time, it is known as chronological classification. For example:- Population of India (1951-1991)
3.Qualitative Classification In this type of classification, data are classified on the basis of some attribute or quality such as sex, literacy, religion, etc. Qualitative Classification Simple Classification Manifold Classification
4.Quantitative Classification When data are classified on the basis of some characteristics which is capable of direct quantitative measurement such as height, weight, income, marks, etc., it is called quantitative classification. For example:- Students may be classified according to weight in table
Variable The characteristic, which is capable of direct quantitative measurement is called a variable or variate . Variable Discrete Continuous variable variable
Way to classify numerical data or raw data Numerical data or Raw data Ordered array or Frequency Individual series distribution Discrete series Continuous series
General rules for constructing a grouped frequency distribution 1.Selection of number of classes 2.Size (or width) of class intervals 3.Selection of class limits 4.Kinds of continuous series
1.Selection of number of classes There are no hard and fast rules about the selection of number of classes. It depends on number of factors such as:- *The number of items to be classified *The magnitude of the class interval *The accuracy desired *The ease of calculation for further processing of data *size of class intervals Prof. H.A.Sturge gave a formula by which the number of class interval can be ascertained. The formula is k =1+3.322log N (Here k= number of class intervals, N=number of observations)
2.Size (or width) of class intervals The choice of class interval depends on the number of classes for a given distribution and the size of the data. Prof. Sturge has given the following formula for determining the size of class intervals:- Size of class interval:i= Largest value-Smallest value 1+3.322logN
3.Selection of class limits Class limits should be selected in such a way that- *The mid values of classes coincide or come very close to the point of concentration in the data. *The overlapping of classes is avoided. *The class limits must be stated precisely enough so that there will be no confusion as to what they include.
4.Kinds of continuous series There is another important problem relevant to constructing a frequency distribution. These relate to kinds of grouped or continuous series to be formed. The following are the important kinds of continuous series:- (a)Exclusive series (b)Inclusive series (c)Open ended series (d)Mid-value series (e)Cumulative frequency series
(A)Exclusive series Exclusive series is that series in which every class interval excludes items corresponding to its upper limit. In this series, the upper limit of one class interval is the lower limit of next class interval. Exclusive series
(B)INCLUSIVE SERIES An inclusive series is that series which includes all items upto its upper limits, the upper limit of class interval does not repeat itself as a lower limit of the next class interval. Inclusive series
(C)OPEN ENDED SERIEs In some series, the lower class limit of the first class interval and the upper limit of the last class interval are missing. Instead, less than or below and more than or above is specified. Open ended series
(D)MID-VALUE SERIES Frequency series containing mid-values is that series in which we have only mid-values of the class intervals and the corresponding frequencies. Mid-value series
(E)CUMULATIVE FREQUENCY SERIES Cumulative frequency series is that series in which the frequencies are added corresponding to each class interval in the distribution. The frequencies than become cumulative frequency. Cumulative frequency series
CONCLUSION At last conclusion of classification of data is, it makes data comparative, attractive , effective and very simple . Classification clearly shows differences or comparison of figures . One important point is that it makes data ready for further statistical process.